The Aigon Dashboard is a browser-based control centre for all your repos. Monitor agent progress, launch features, run evaluations, and merge winners — all from one place.
Getting started
aigon server start --persistent        # One-time: install as system service
aigon server add ~/src/my-project      # Register a repo with the server
Then open http://localhost:4100 in your browser.
Persistent mode installs the server as a launchd agent (macOS) or systemd user service (Linux). It starts on login, survives terminal closes, and auto-restarts on crash. See the server command reference for details.
You only need to run
aigon server start --persistentonce — after that the server is always available.
The dashboard polls registered repos every 30 seconds and fires macOS notifications when agents reach waiting or when all agents submit.
Dashboard and CLI: two views, same workflow
The dashboard and CLI are interchangeable views of the same state. Any action you take in one is immediately visible in the other.
| Action | CLI | Dashboard |
|---|---|---|
| View all features | aigon board | Pipeline tab |
| Start a feature | aigon feature-start 42 cc gg | ”Start” button on a card |
| Monitor agents | aigon status 42 | Real-time agent status badges |
| Evaluate | aigon feature-eval 42 | ”Evaluate” button |
| Close/merge | aigon feature-close 42 cc | ”Close” button with agent picker |
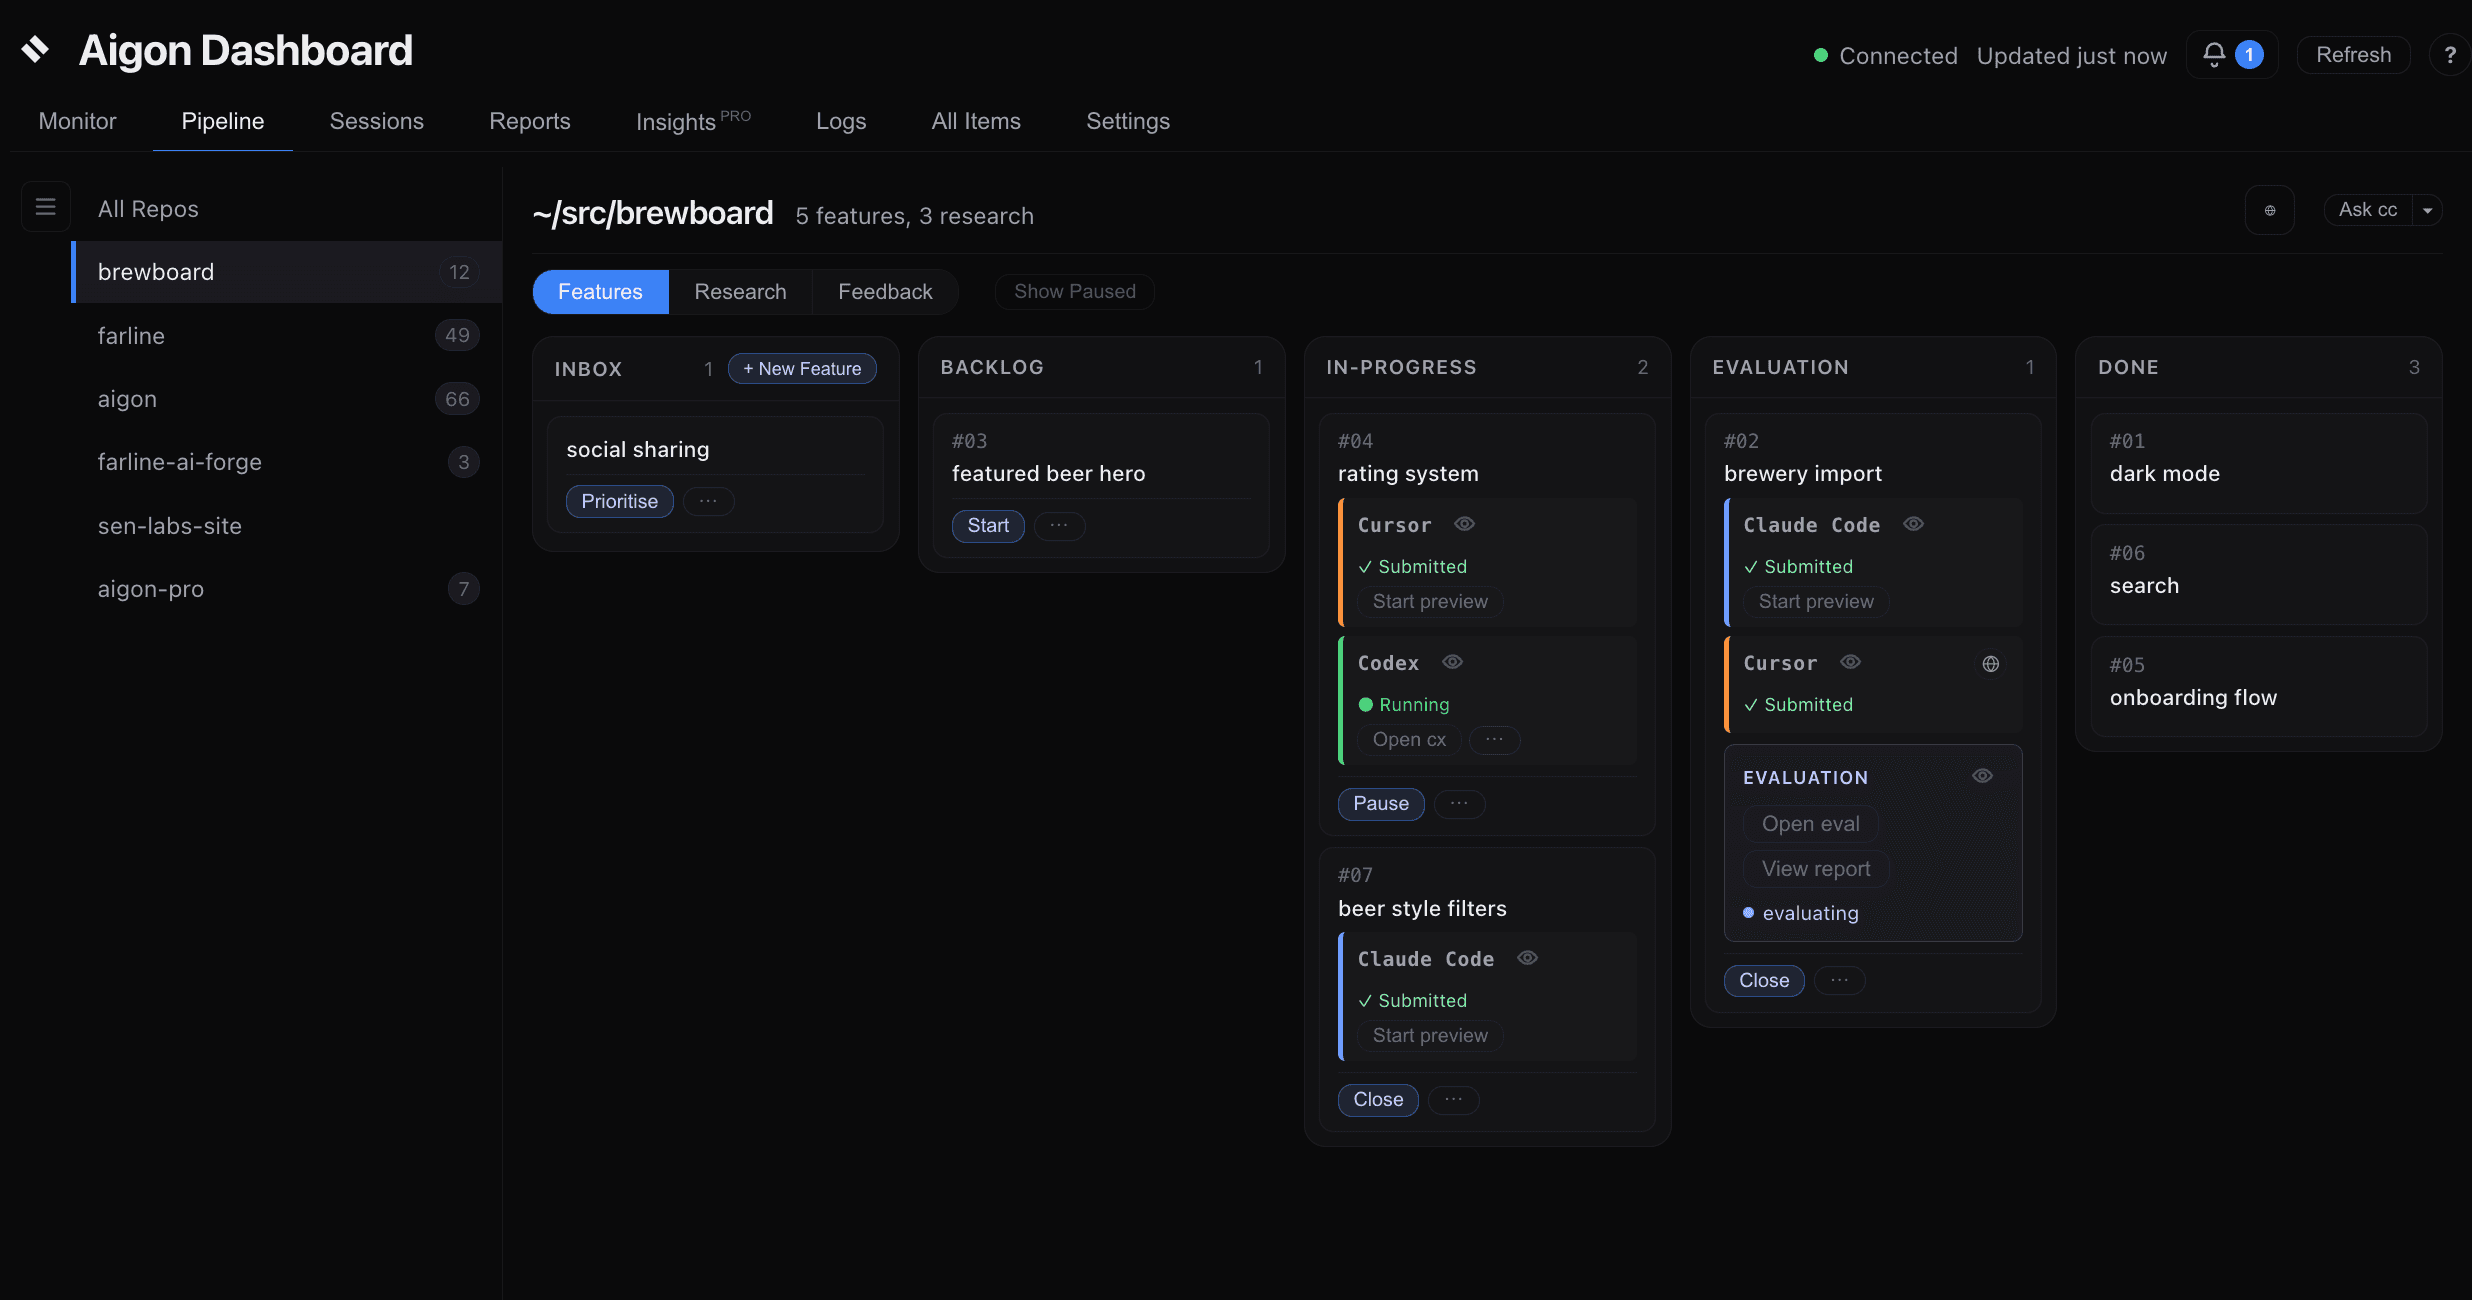
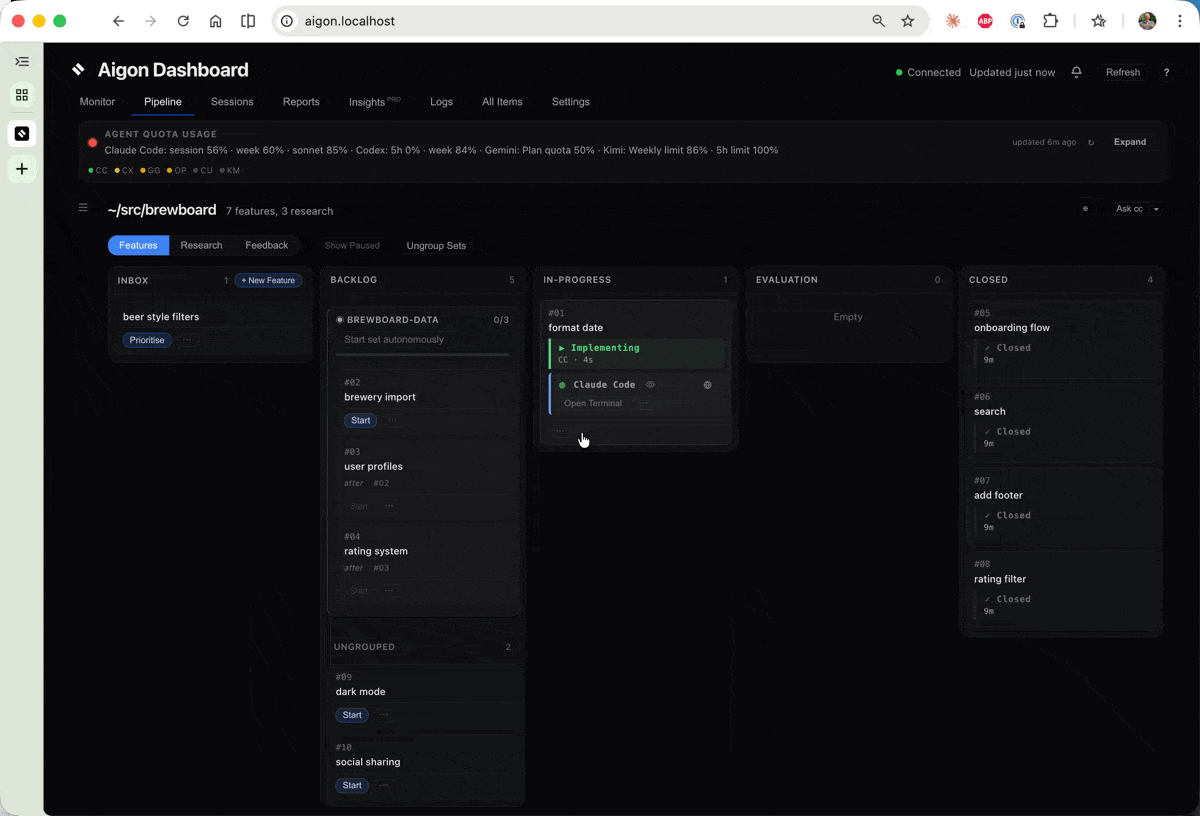
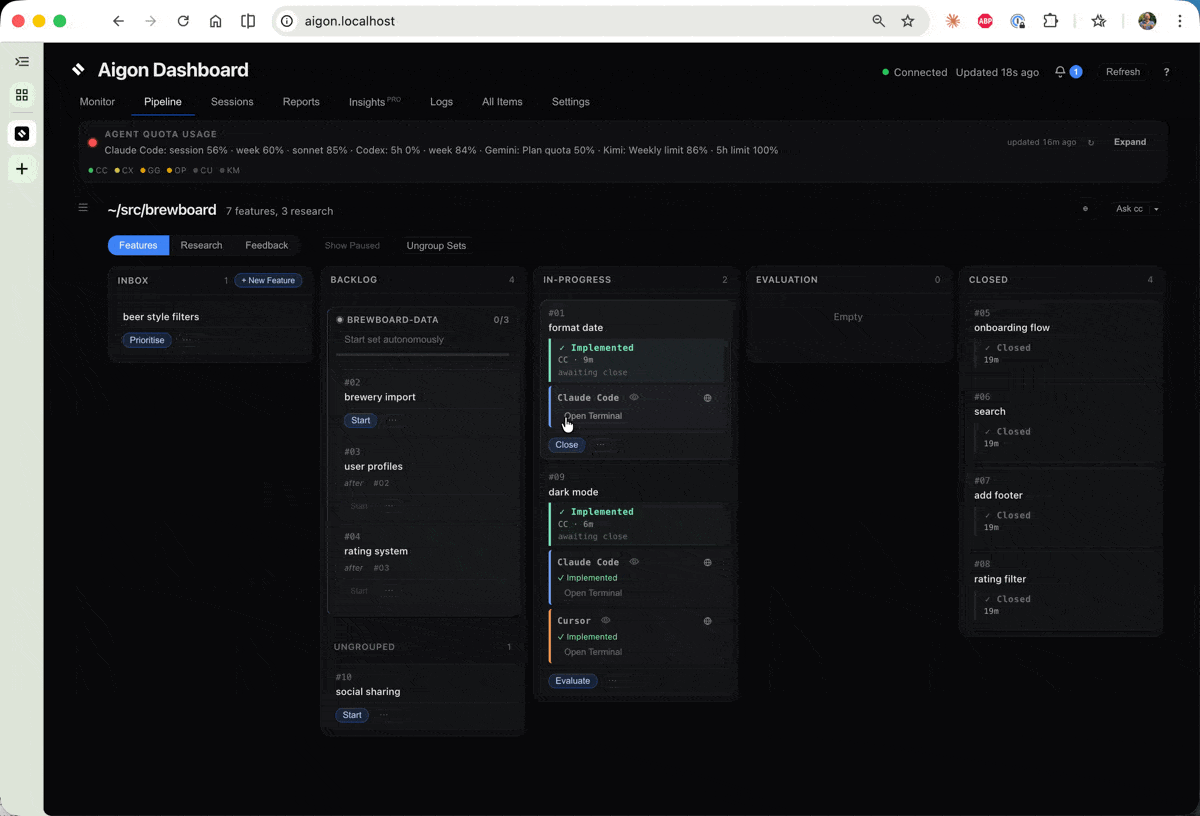
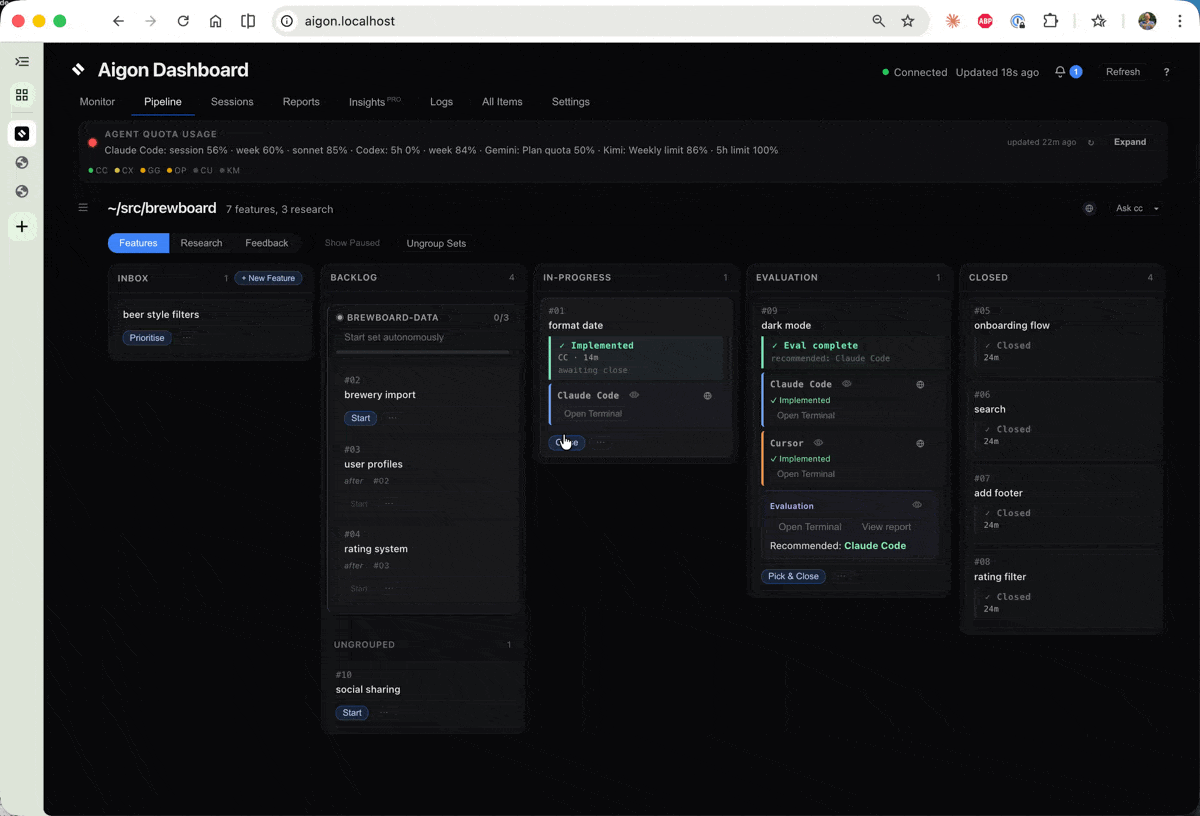
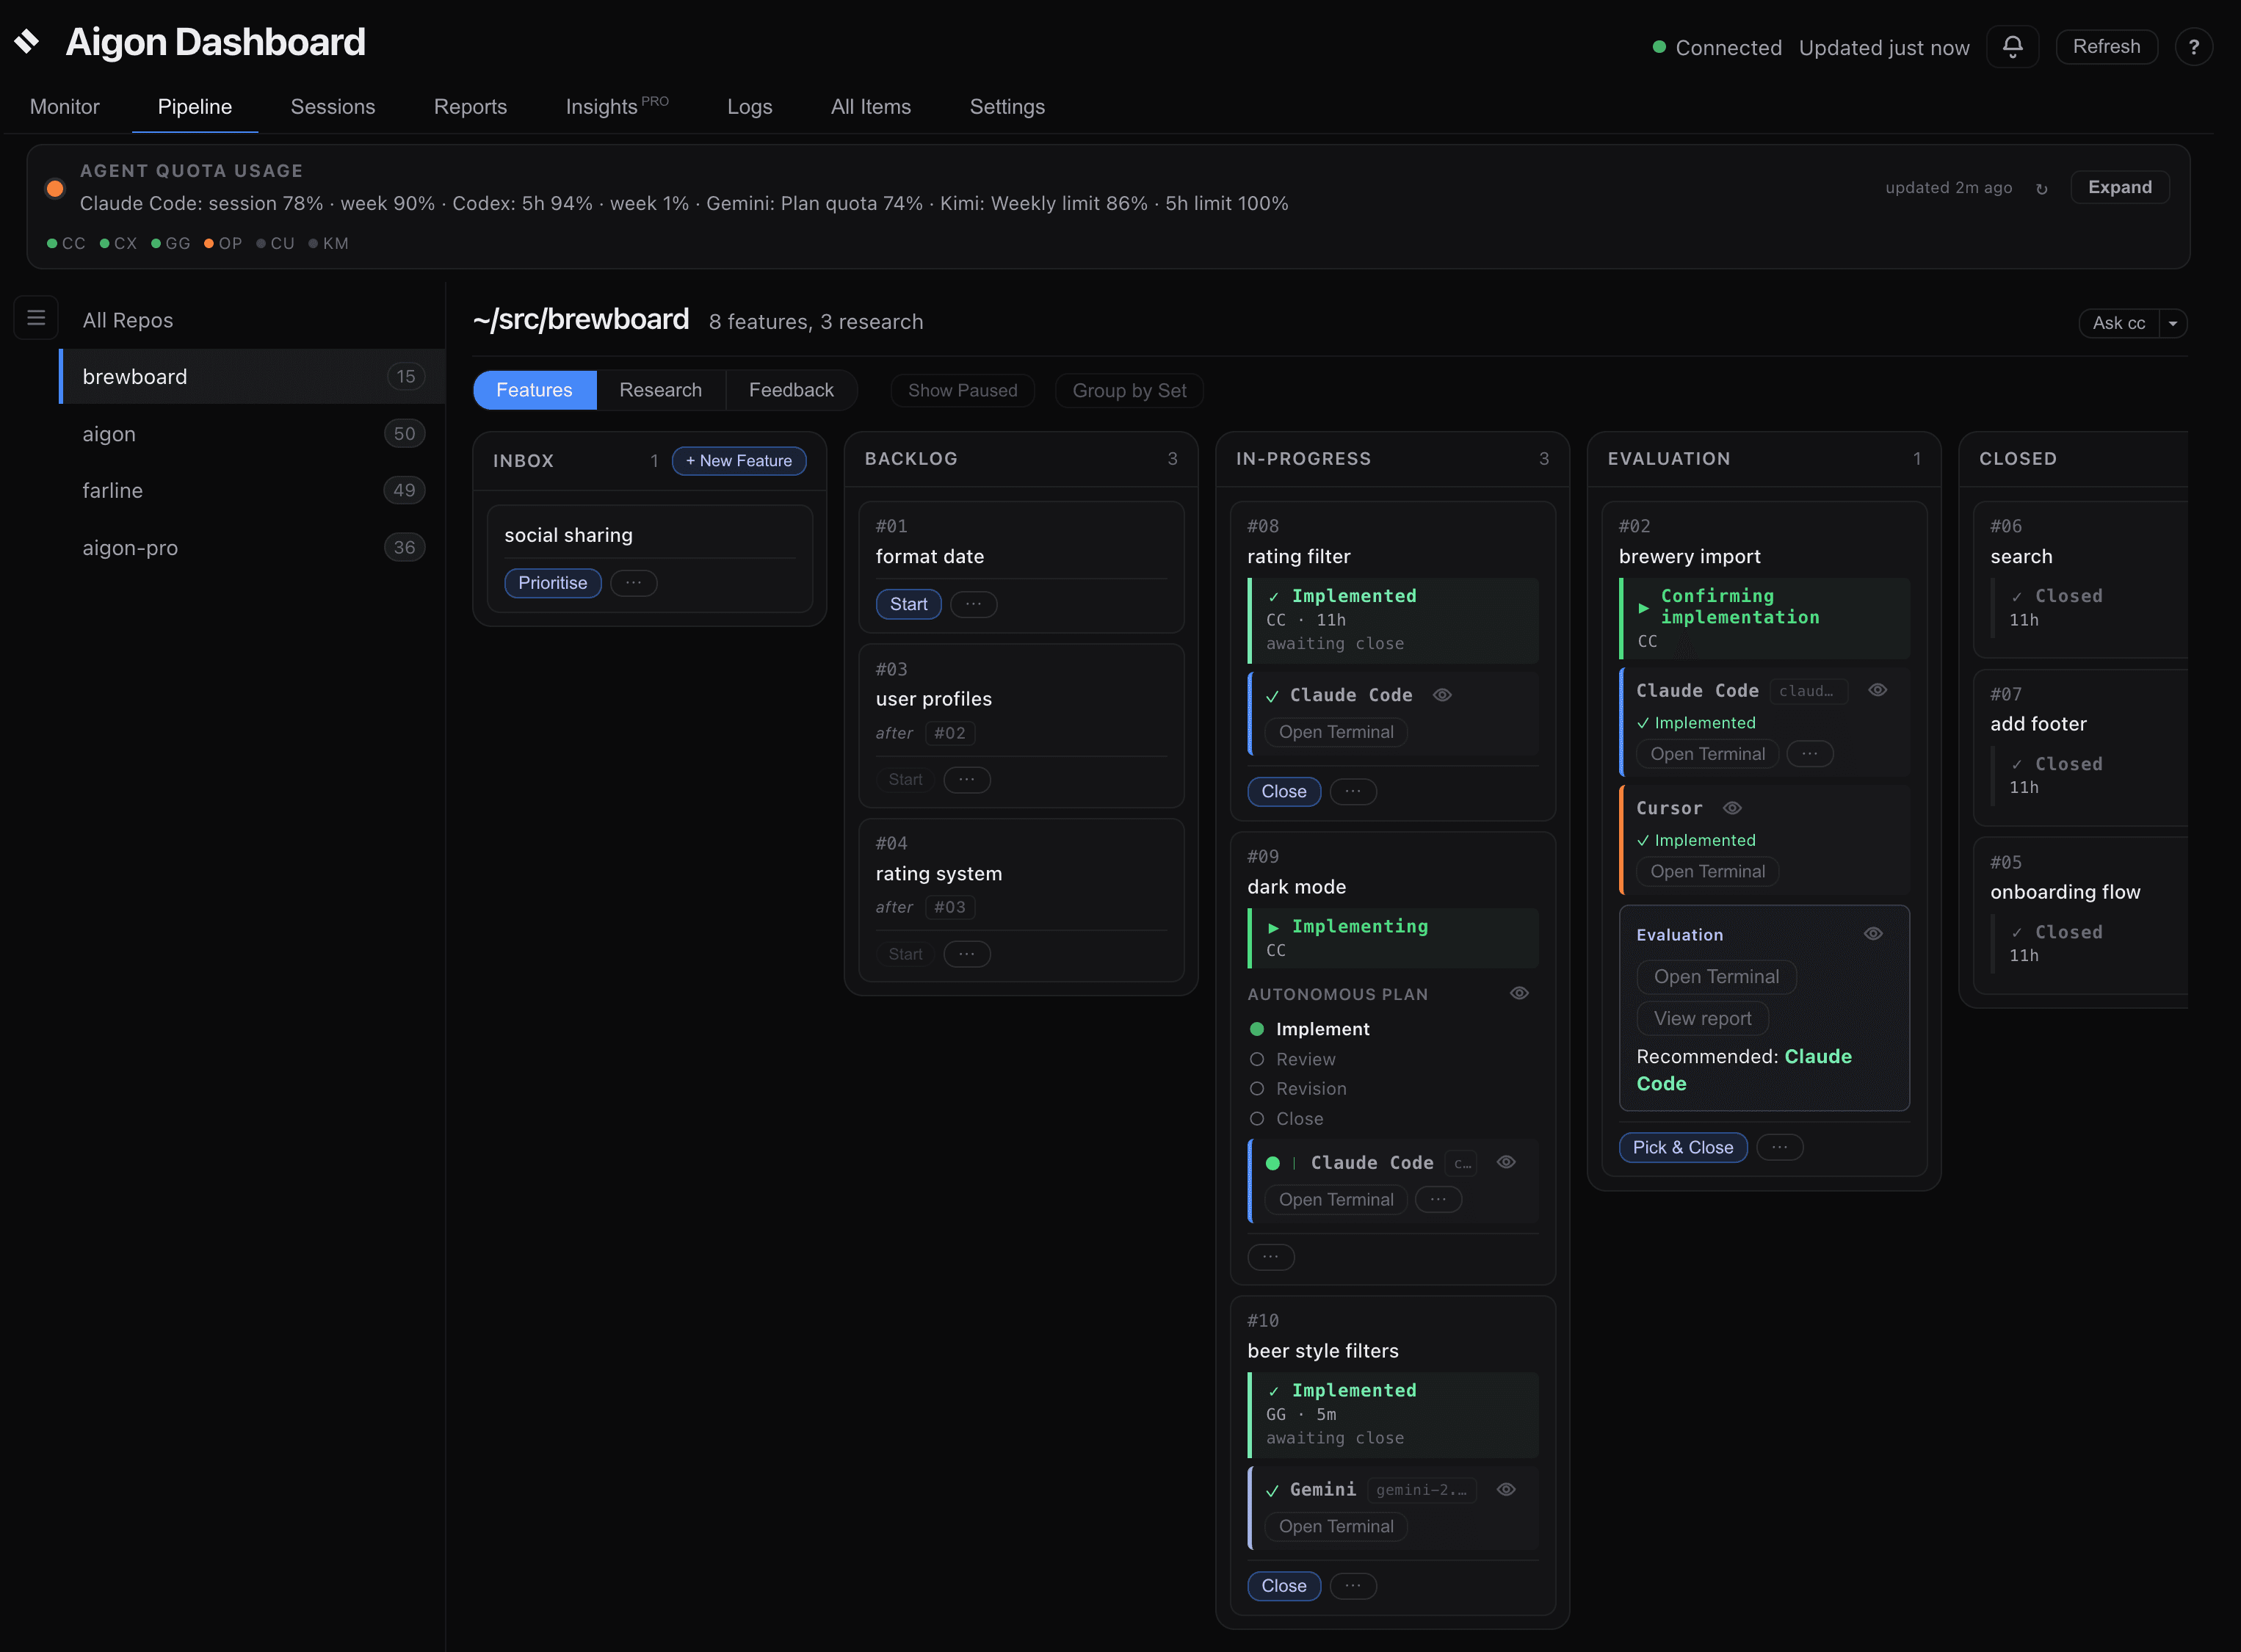
Pipeline
Drag features through the pipeline: inbox → backlog → in-progress → in-evaluation → done. The Remaining quota before reset strip at the top summarises cached Claude Code and Codex limits — see Usage limits on the Pipeline.
Fleet monitoring
Watch agents compete in real-time. The dashboard shows status badges for each agent and surfaces action buttons when they submit.
Feature cards
If your repo uses a GitHub remote, feature cards include a GitHub section where you can check PR status on demand with manual refresh. See the GitHub Integration guide for prerequisites, status meanings, and expected behavior.
Awaiting input
When an agent is blocked on a decision, it can emit aigon agent-status awaiting-input "<question>". The feature card then shows a pulsing Awaiting input badge with the question text so you can see exactly what is blocking progress from the dashboard.
The badge clears automatically when the agent reports its next status, so cards do not get stuck showing stale prompts after work resumes.
Model and effort picker
When you start a feature from the dashboard, each agent slot includes a model picker and effort picker. The selected triplet is stored in workflow state so the choice survives server restarts and later respawns.
Complexity-driven defaults: If the feature spec (or research topic) has valid YAML frontmatter with a complexity level, the dialog shows a short explanation under the title and pre-fills each row from that complexity plus each agent’s built-in complexity ladder in templates/agents/<id>.json (not from model names stored in the spec). Default in a dropdown still means your global aigon config value; change any row before Start if you want a one-off override. Details and the full resolution order are in the Agents reference.
After launch, the card shows the selected model and effort on the agent row so you can confirm exactly what configuration is running.
Review-check statuses
After a code review completes, the implementing agent row can show two follow-up states while review feedback is being handled:
- Addressing review means the agent is actively working through the review findings.
- Feedback addressed means the implementation agent finished the requested follow-up and signaled completion.
These statuses make review handoff visible without requiring you to open the session log.
Close with agent
If feature-close fails because of a merge conflict or another closing error, the card exposes a Close with agent button. That action starts an agent session specifically to unblock the close rather than making you leave the dashboard and recover manually.
Use it when the failure needs code changes or conflict resolution inside the worktree before the feature can be merged.
Feature Sets
If multiple features belong to a coordinated effort, add a set: <slug> frontmatter key to each spec and Aigon renders a dedicated Set card at the top of the pipeline. Each card shows:
- Progress bar (merged / total members)
- Status label (
idle,running,paused-on-failure,done) - Current feature id and the last set-auto event
- Dependency mini-graph — members are colored by workflow state (backlog / in-progress / in-review / done / failed), intra-set
depends_onedges are drawn
Action buttons (Start, Stop, Resume, Reset) invoke the set-autonomous-* commands. Button eligibility is derived server-side by lib/feature-set-workflow-rules.js and delivered in the validActions payload — the card is a read-only view of engine state.
aigon set list              # All sets with stage counts
aigon set show <slug>       # Members in dependency order + intra-set edges
Set-level autonomous actions (set-autonomous-start / -stop / -resume / -reset) are Pro features; OSS users see the progress view with the action buttons disabled.
If you want the conceptual walkthrough for how set-level autonomy works end to end, see Feature Sets in Autonomous Mode.
Agent Budget
Claude Code and Codex expose remaining session and weekly budgets. Aigon polls those values every 30 minutes via a throwaway tmux session and caches the result to .aigon/budget-cache.json.
- Settings → Agent Budget shows each agent’s session % and weekly % remaining with colour bars (green ≥ 50 %, amber 20–49 %, red < 20 %) plus a manual refresh button.
- The agent picker on
feature-start/feature-autonomous-startannotatesccandcxrows with inline budget, e.g.cc — 35% session · 3% week ⚠. - Picking an agent with < 20 % remaining on any limit shows a non-blocking confirmation before the run proceeds.
Data flows through GET /api/budget (cached snapshot) and POST /api/budget/refresh (force a re-poll). If tmux or the agent binary is missing, polling is a silent no-op — the dashboard falls back to null per agent.
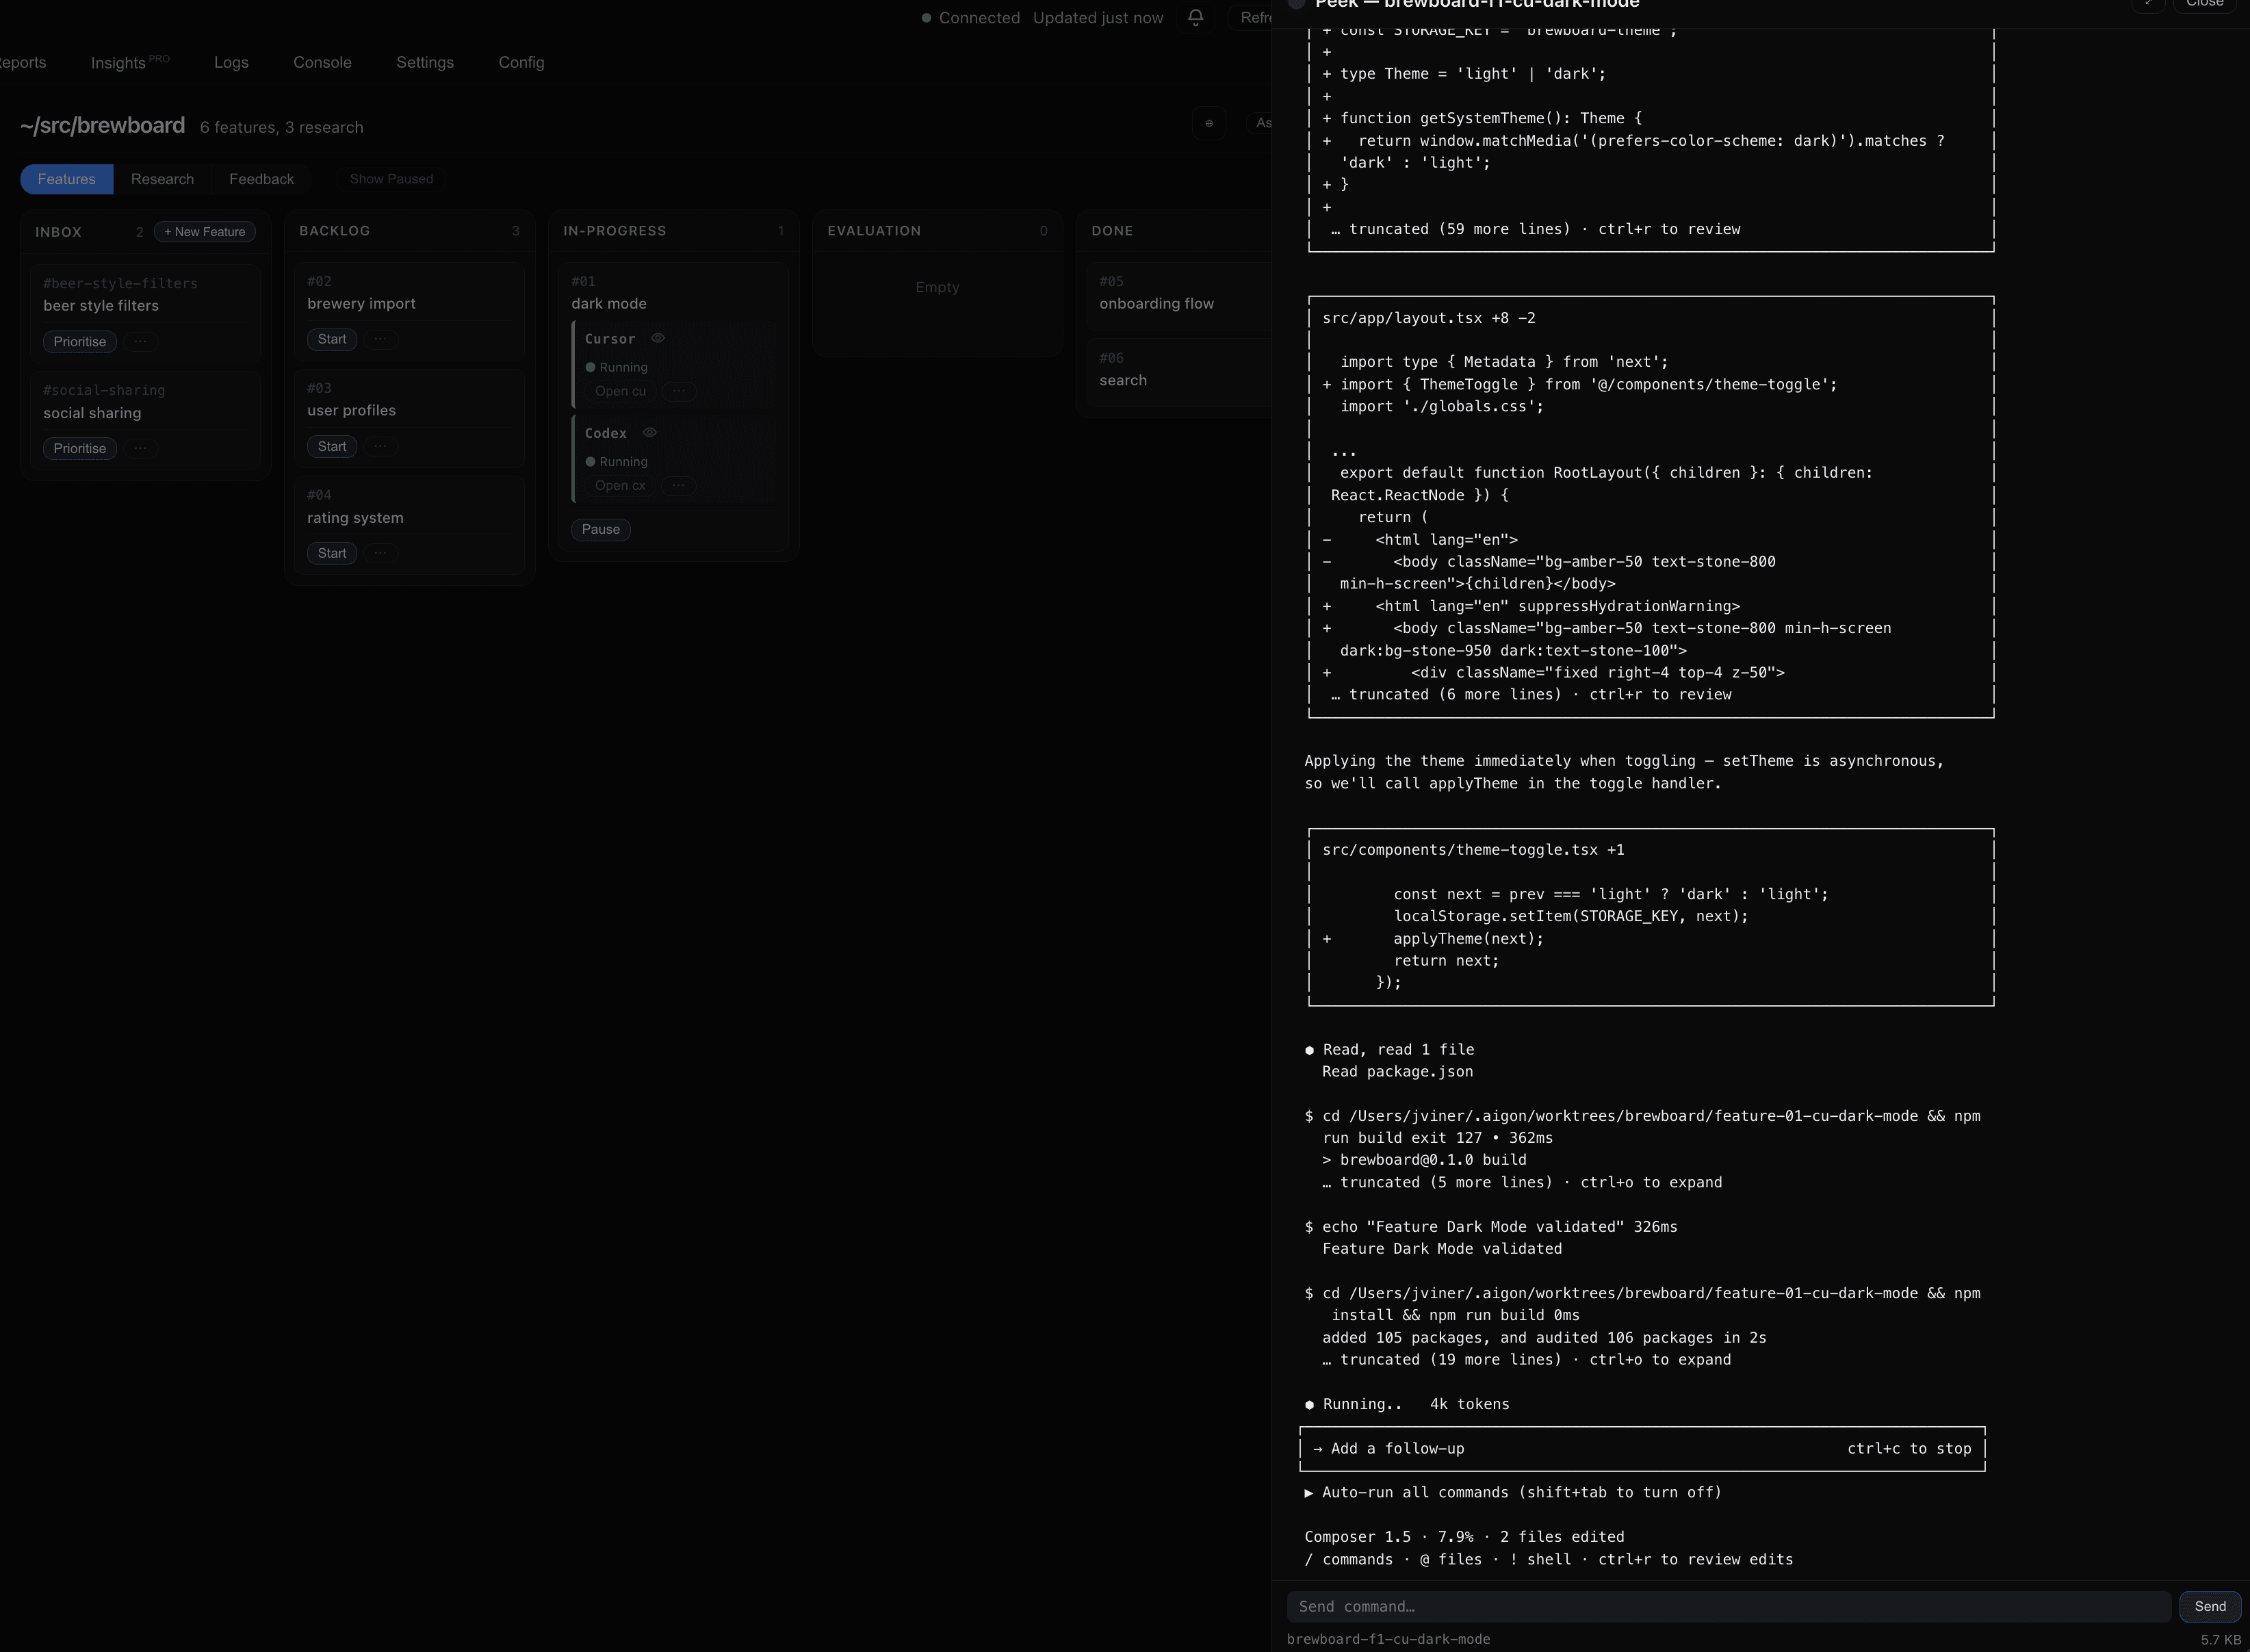
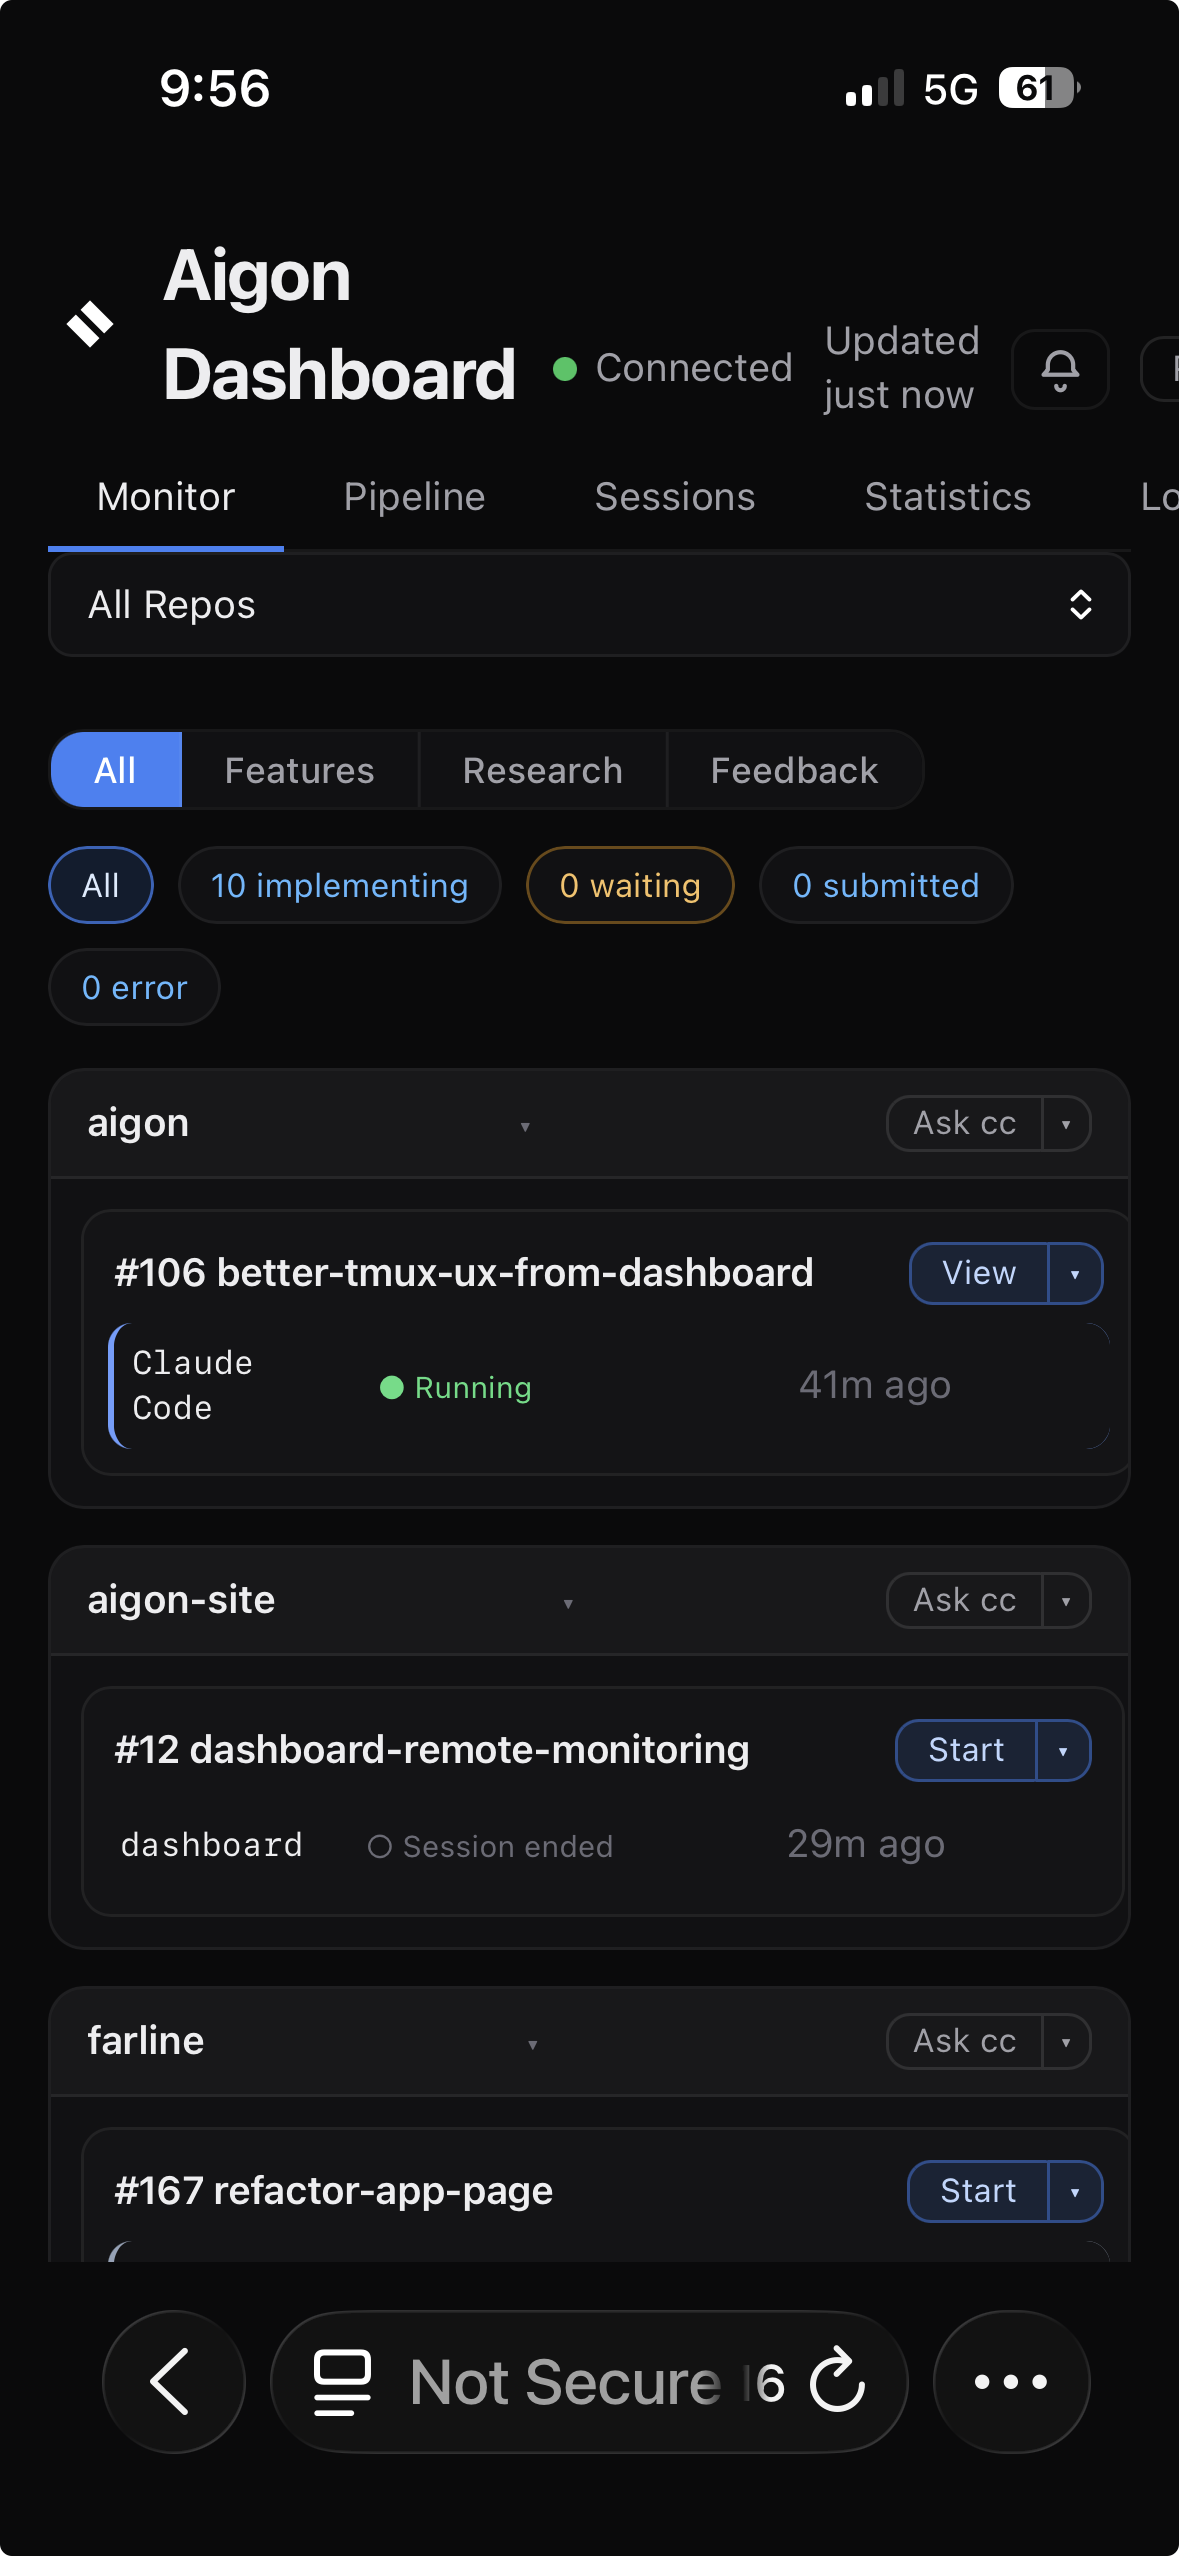
Monitor view
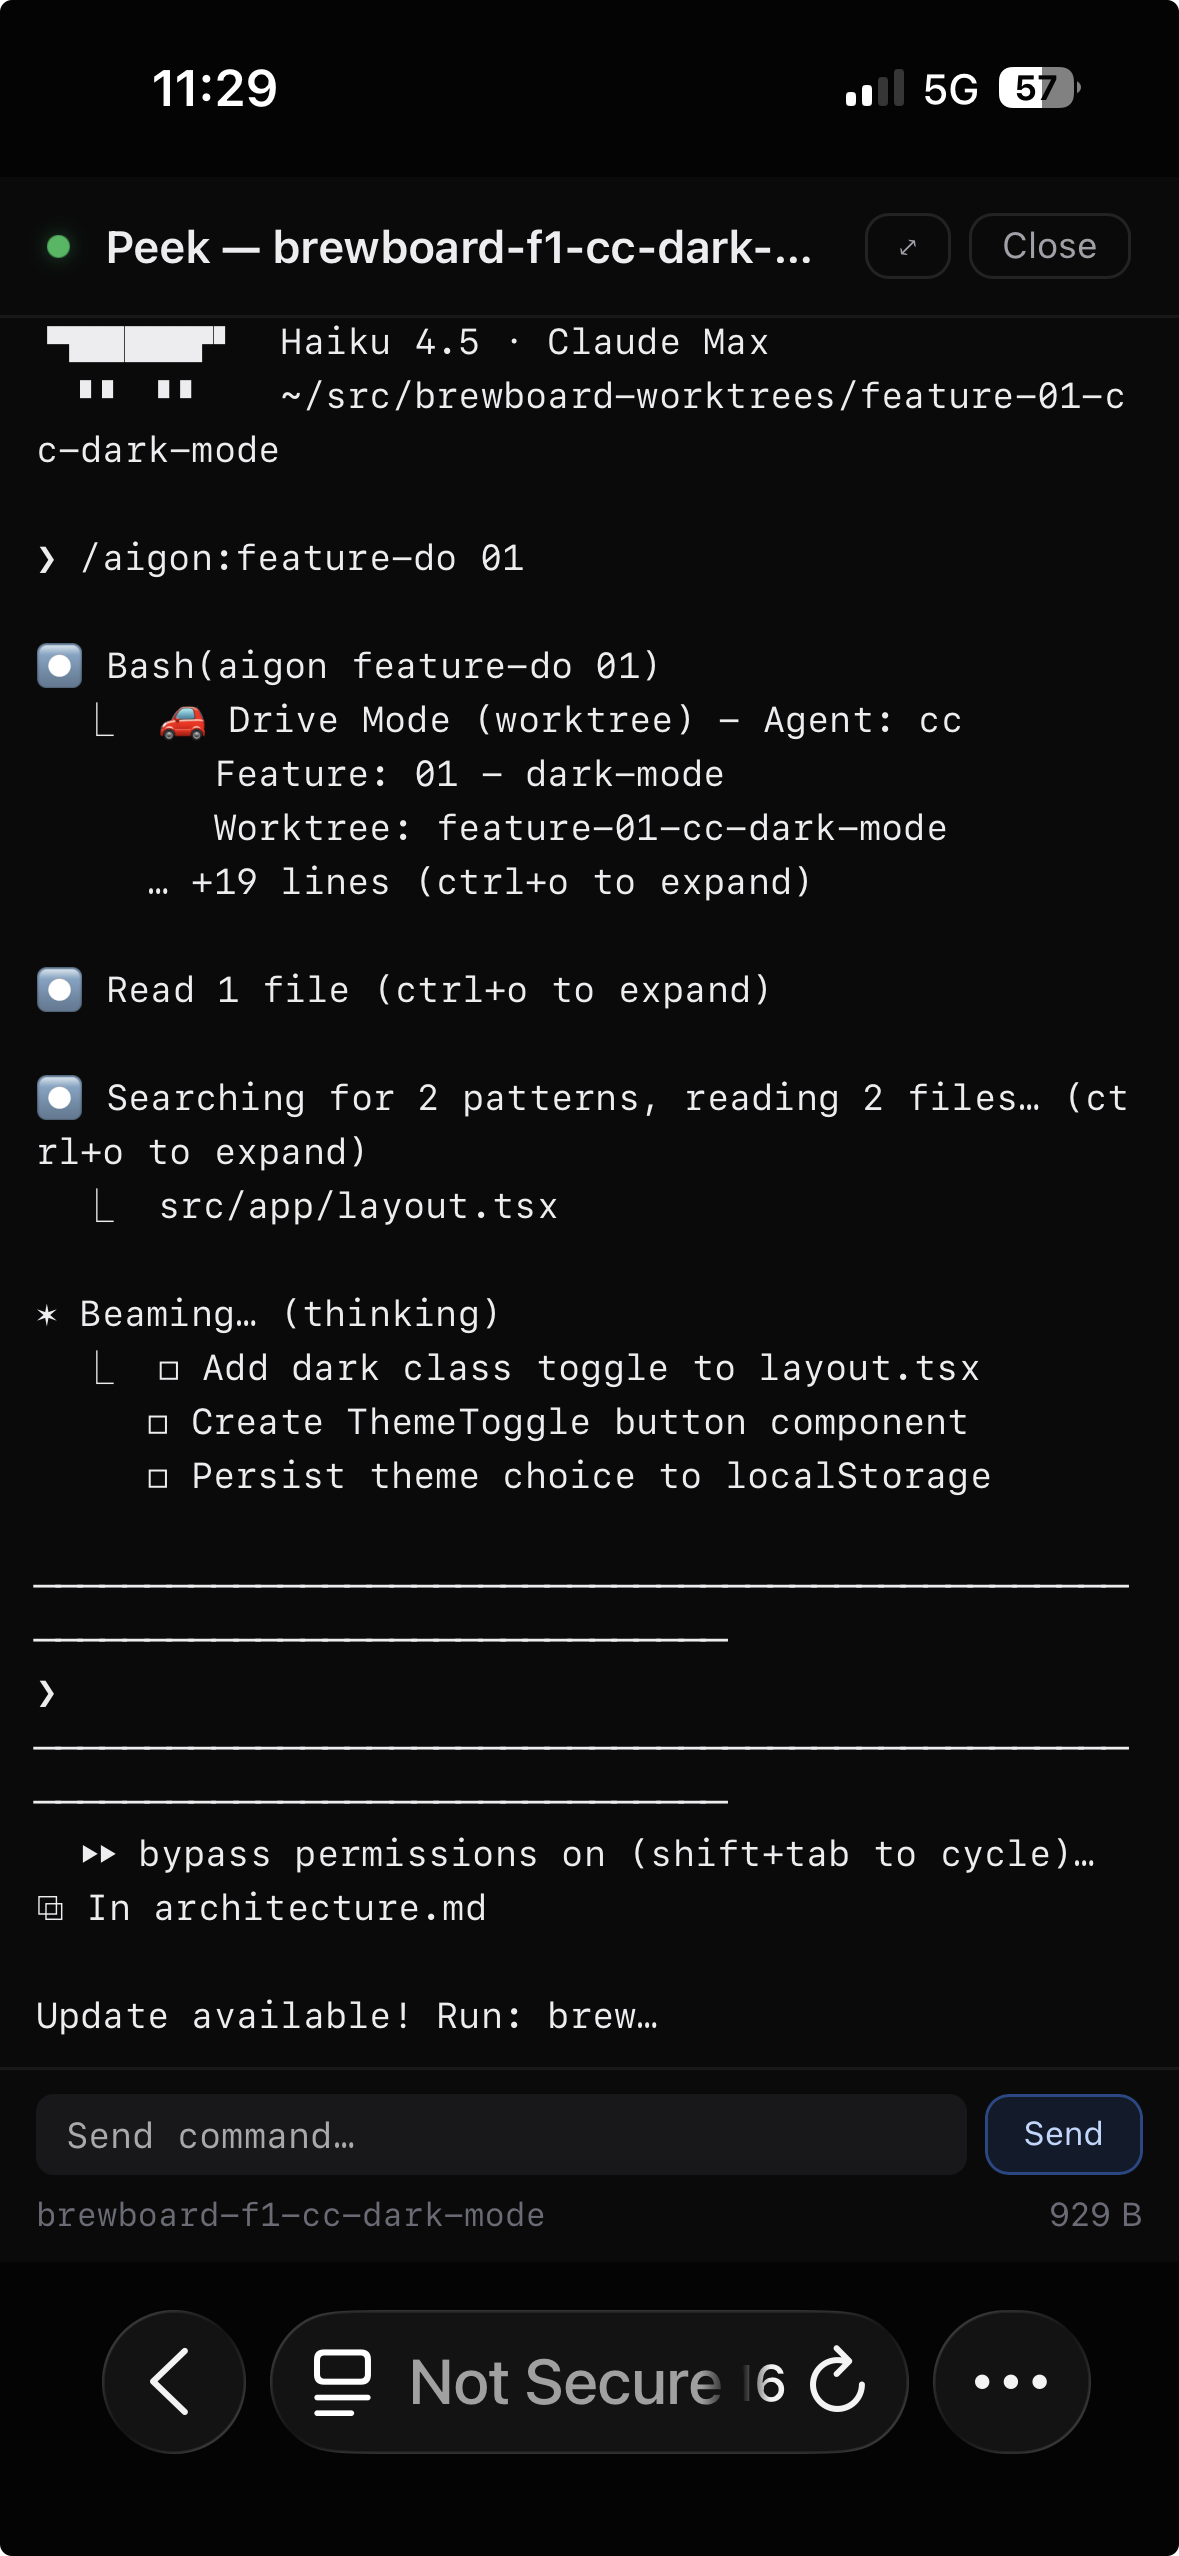
See every agent session across all repos — running, attached, or ended.
Hover over any session card to peek at live agent output without leaving the dashboard.
Reports
Track throughput, cycle time, agent performance, and commit activity across all repos.
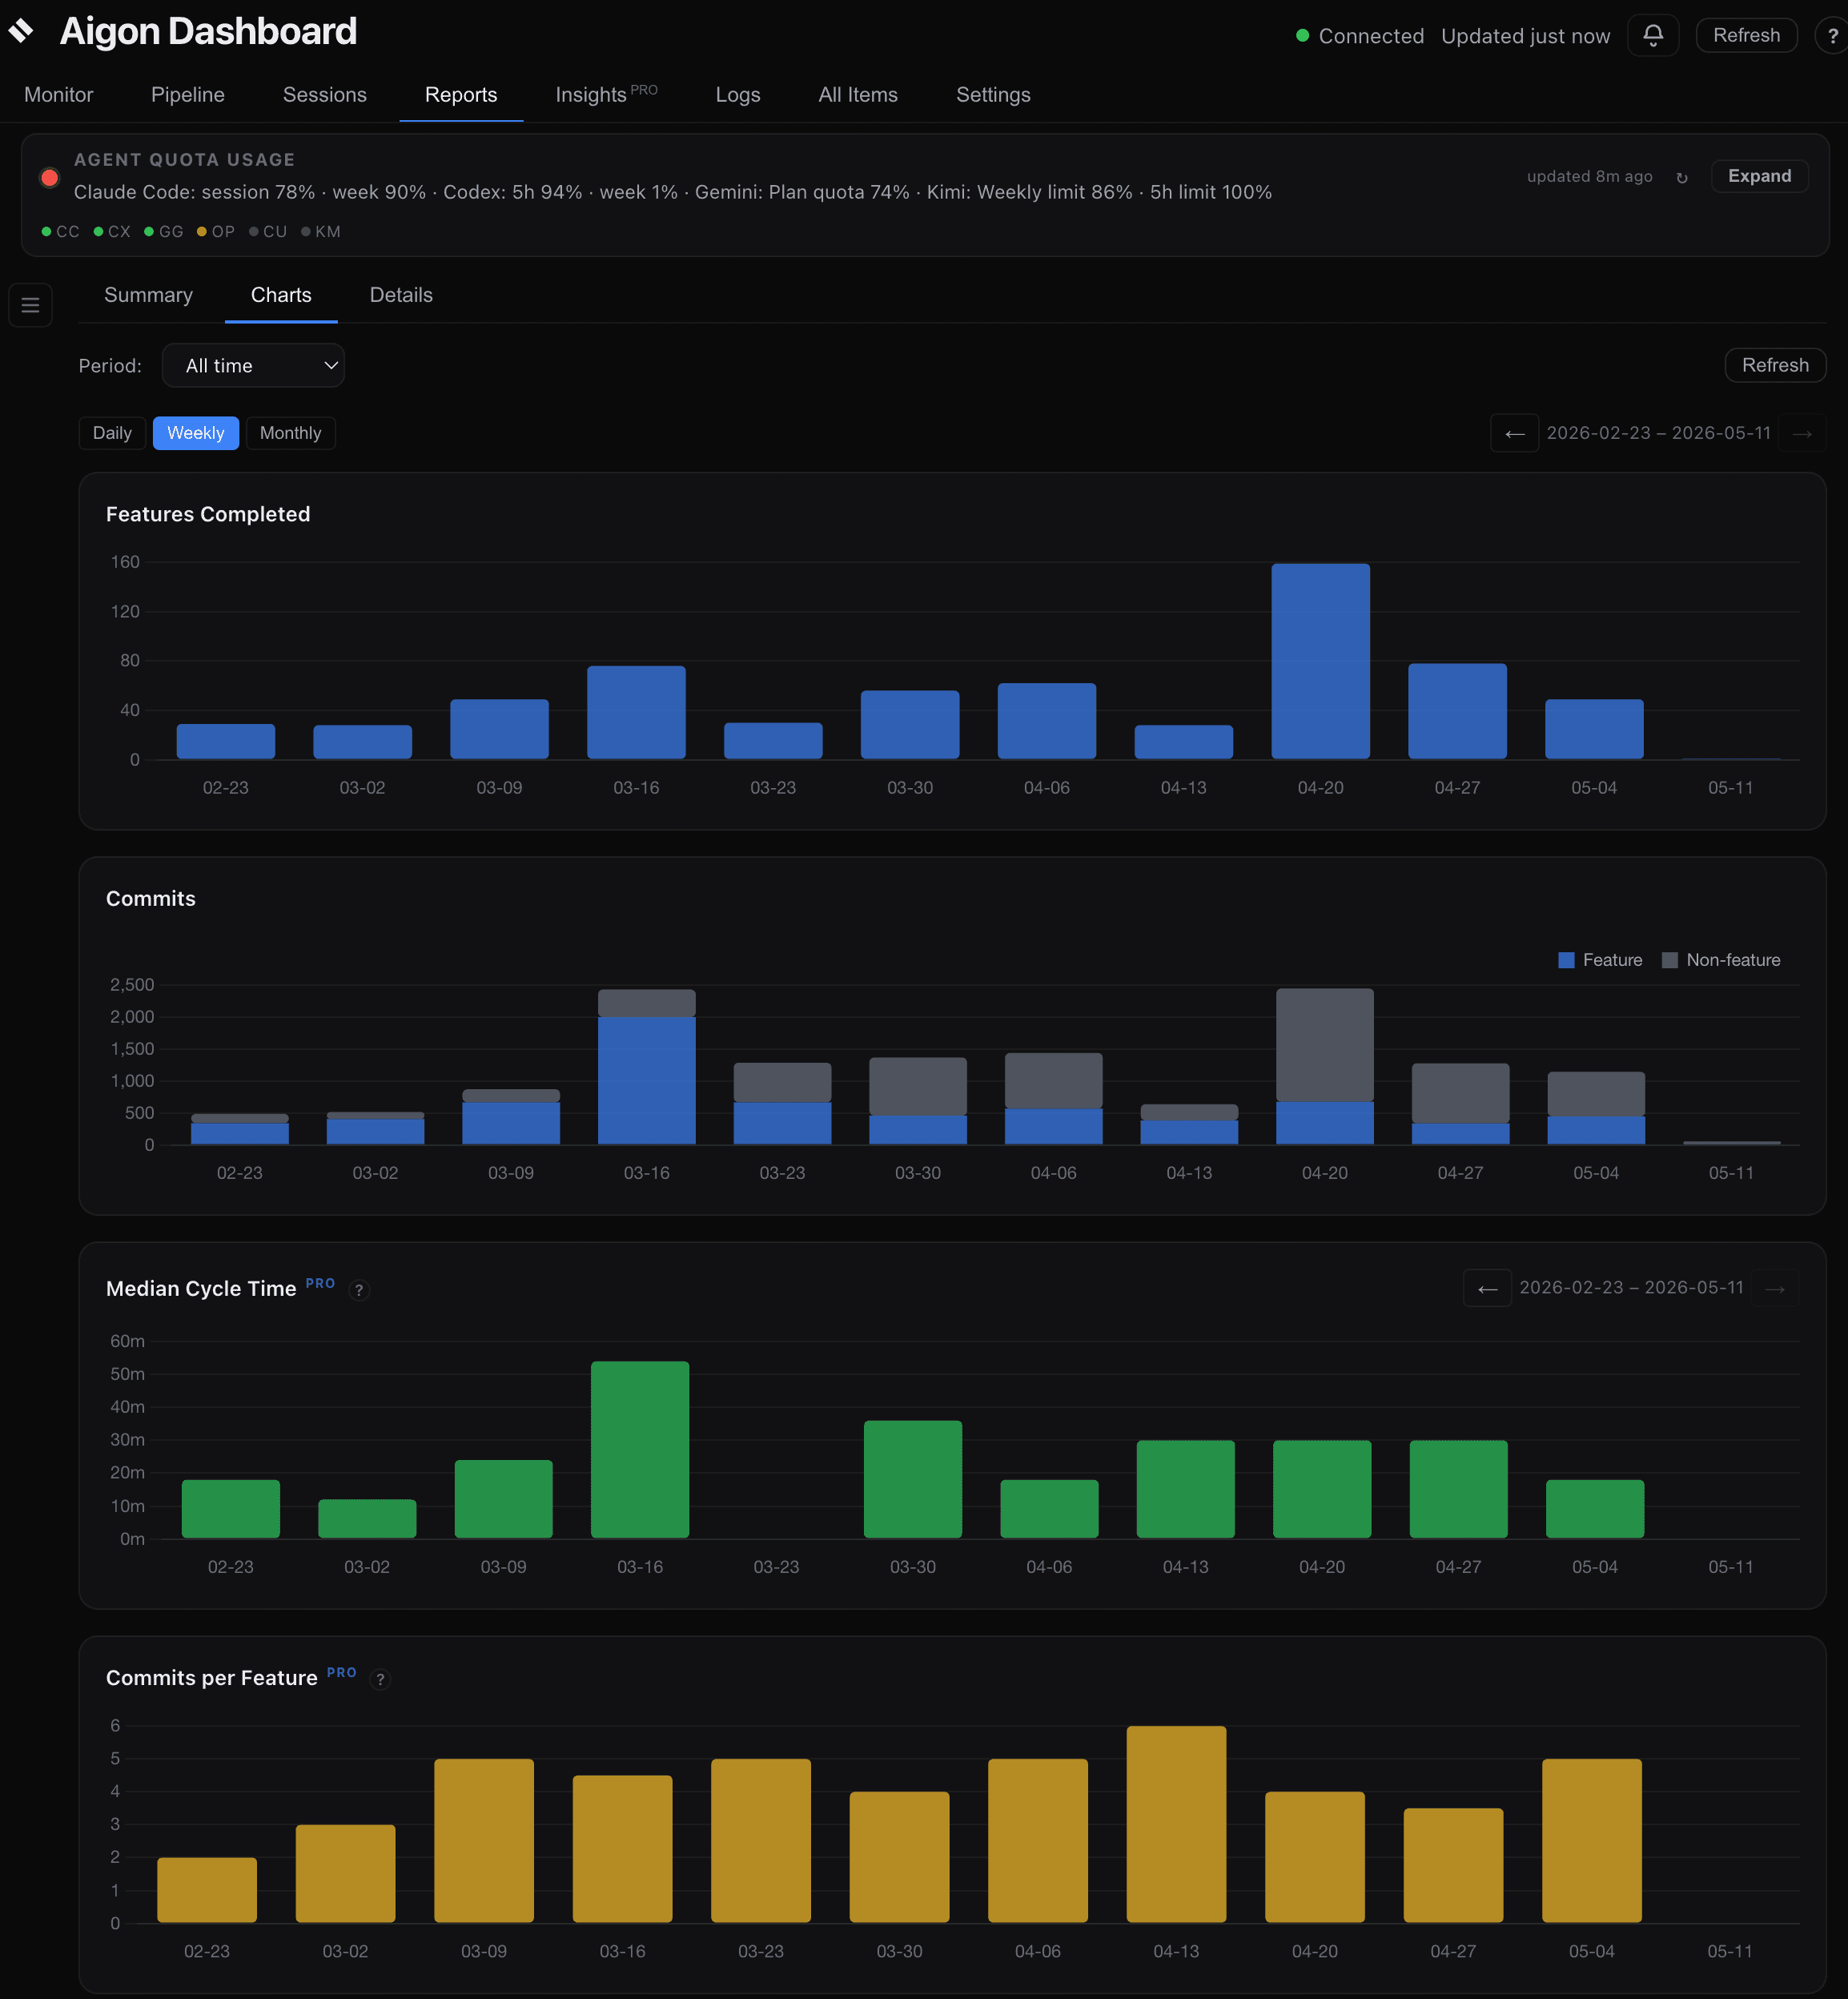
The Reports tab is organized into three sub-tabs:
Summary
High-level metrics at a glance. Uses the global repo sidebar to filter by repo.
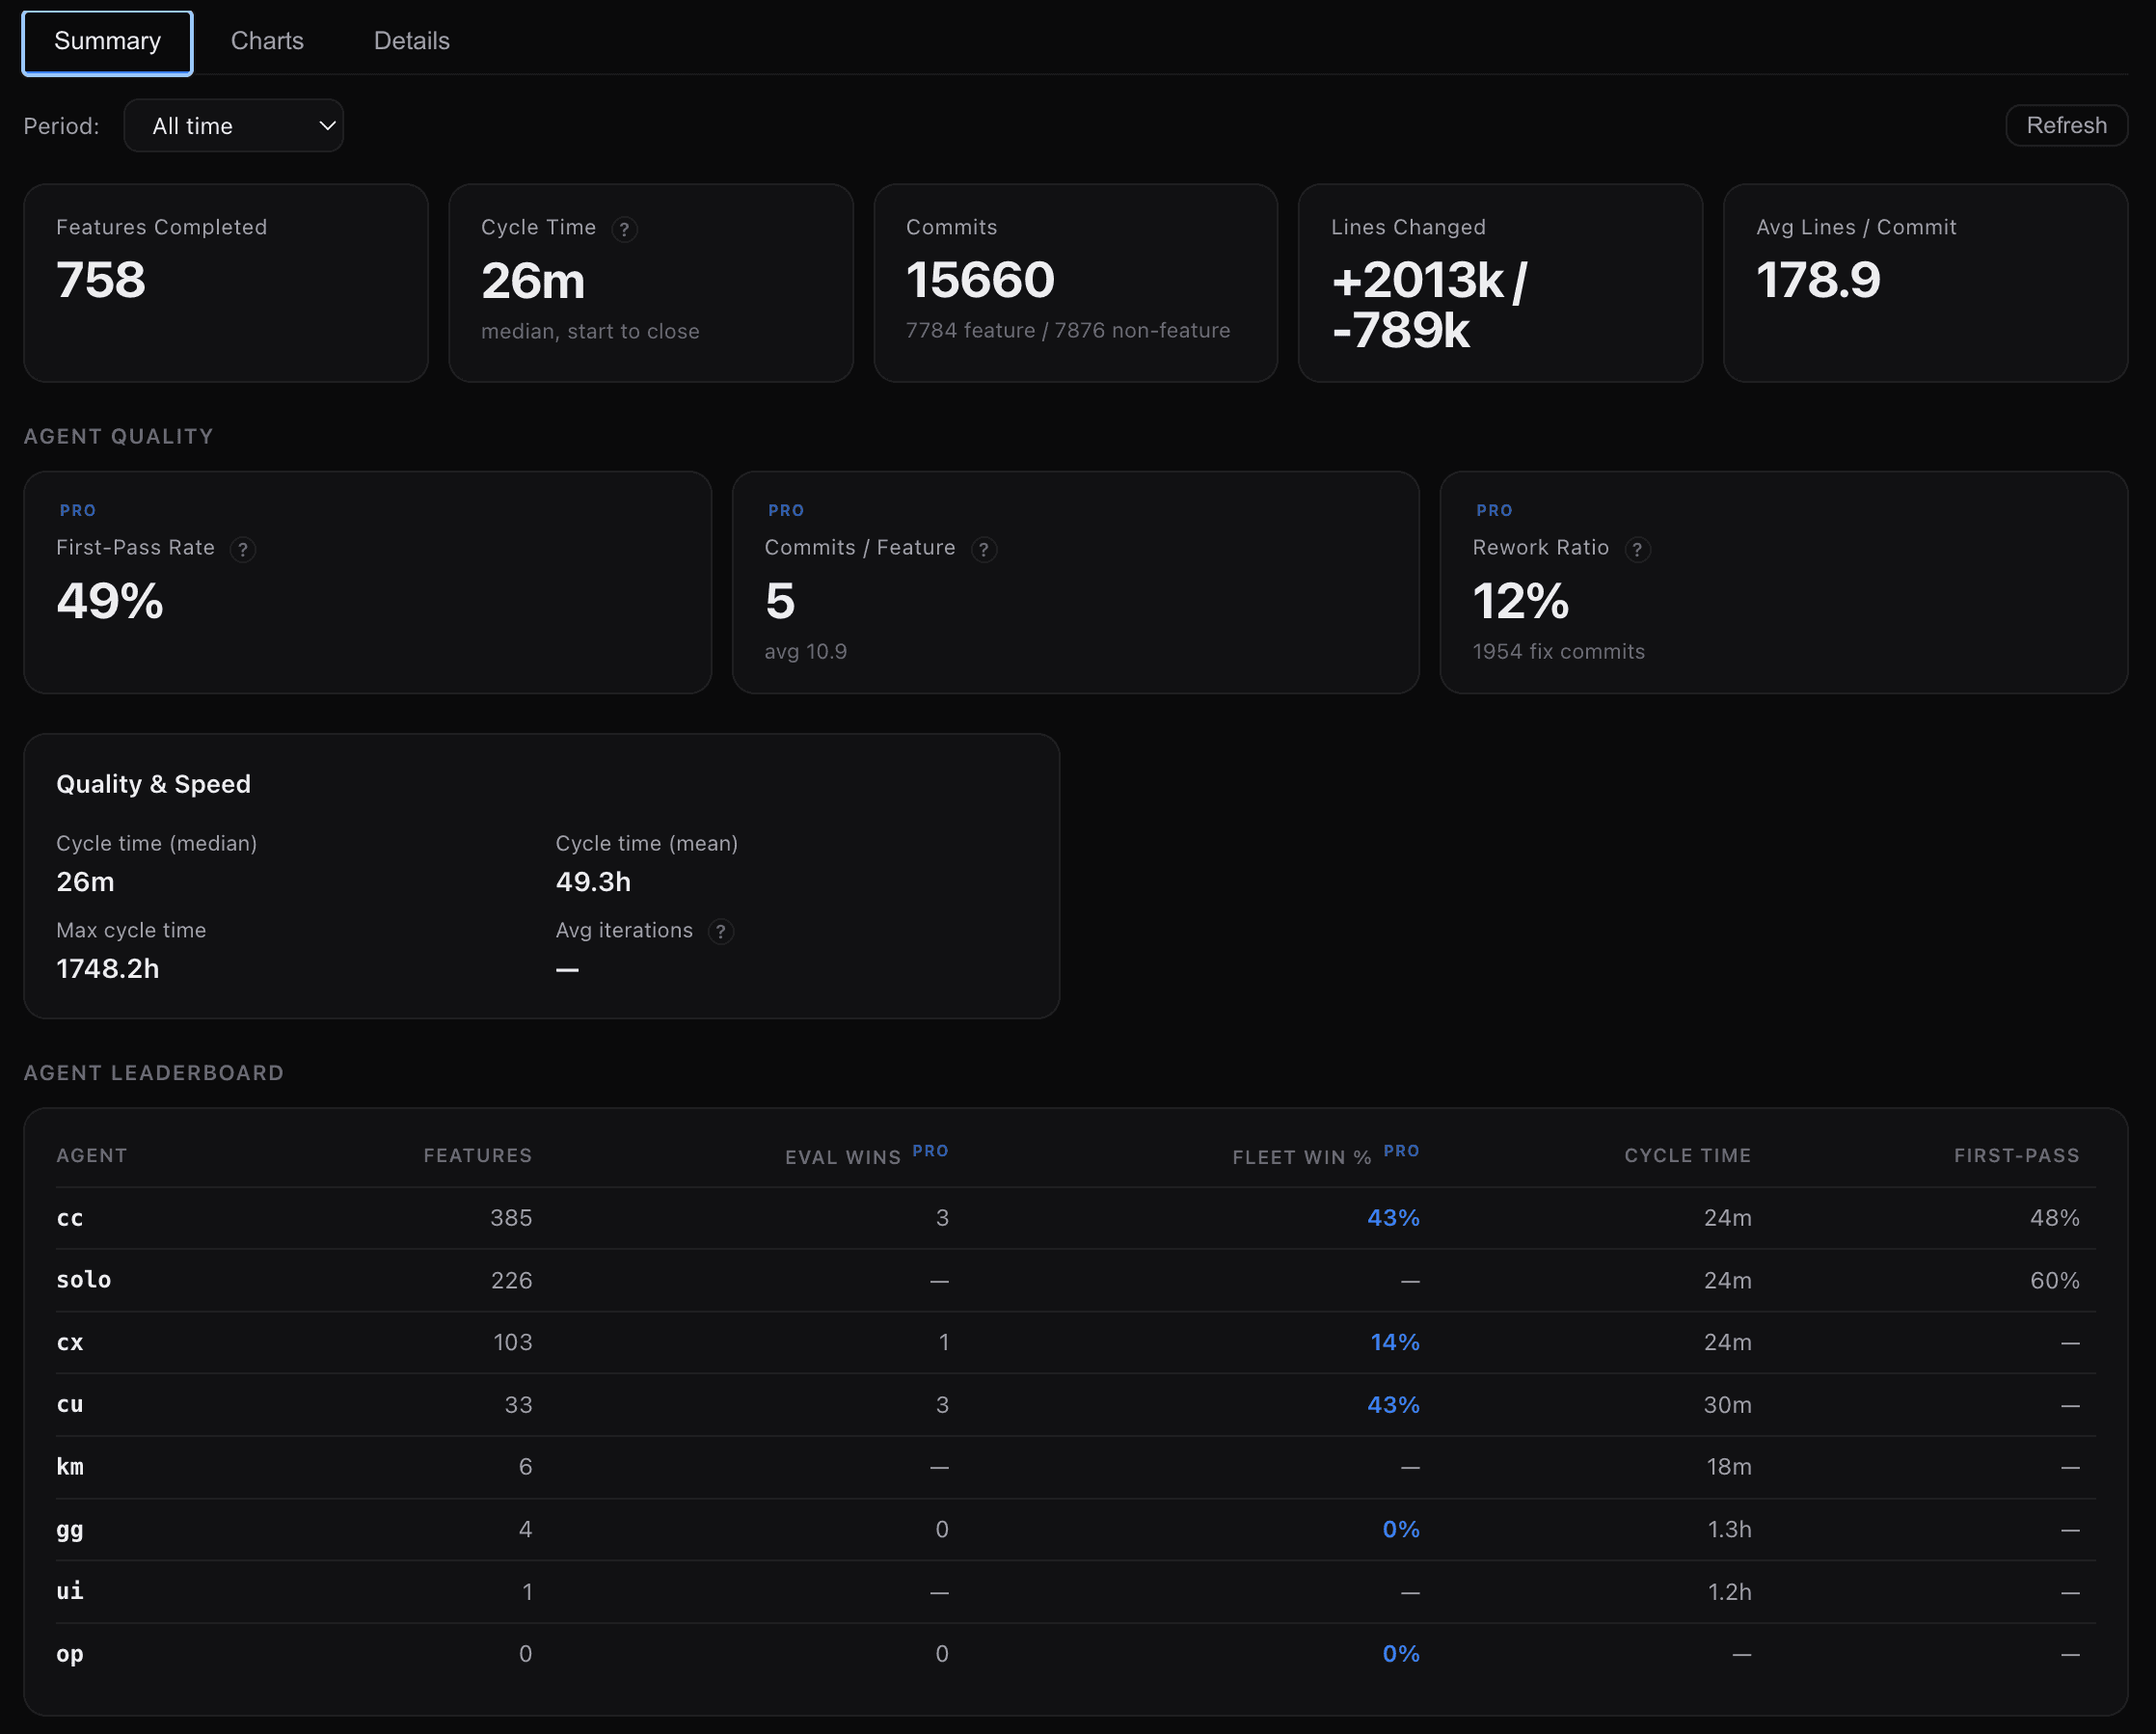
- Features Completed — total features closed in the selected period, with 30-day trend
- Cycle Time — median wall-clock time from feature-start to feature-close
- First-Pass Rate — percentage of features that passed evaluation on the first attempt without rework
- Commits — total commits with feature/non-feature split (e.g., “1314 feature / 686 non-feature”)
- Lines Changed — aggregate lines added and removed across all commits
- Avg Lines / Commit — average lines changed per commit
- Commits / Feature — median number of commits per feature (with average as subtitle). Lower values suggest more focused, single-pass implementations
- Rework Ratio — percentage of commits that are fixes or rework. Lower is better — means more work lands correctly on the first pass
- Quality & Speed — detailed cycle time stats (median, mean, max) and average iterations per feature
- Agent Leaderboard — features completed, eval wins, fleet win %, cycle time, and first-pass rate per agent
Charts
Stacked, full-width charts sharing a unified time axis so dates align vertically:
- Features Completed — bar chart of features closed per period
- Commits — stacked bar chart with two colors: blue for feature-attributed commits and grey for non-feature commits. Shows the ratio of structured (feature) work vs ad-hoc work over time
- Median Cycle Time — bar chart of median cycle time per period. Auto-switches between hours and minutes based on the scale of values in the visible window. Hover tooltip shows the exact value and notes any excluded outliers
- Commits per Feature — median number of commits per feature completed in each period. Tracks whether features are getting more focused (fewer commits) or more complex (more commits) over time
- Rework Ratio — percentage of commits that are fixes (messages starting with
fix:,fixup, orbugfix) per period. Lower is better — trending down indicates agents are producing correct code on the first pass
All five charts share a single Daily / Weekly / Monthly granularity toggle and synchronized left/right panning via shared arrow controls. The date axes are aligned across all charts — periods with no data show as zero-height bars rather than being omitted, ensuring vertical date alignment.
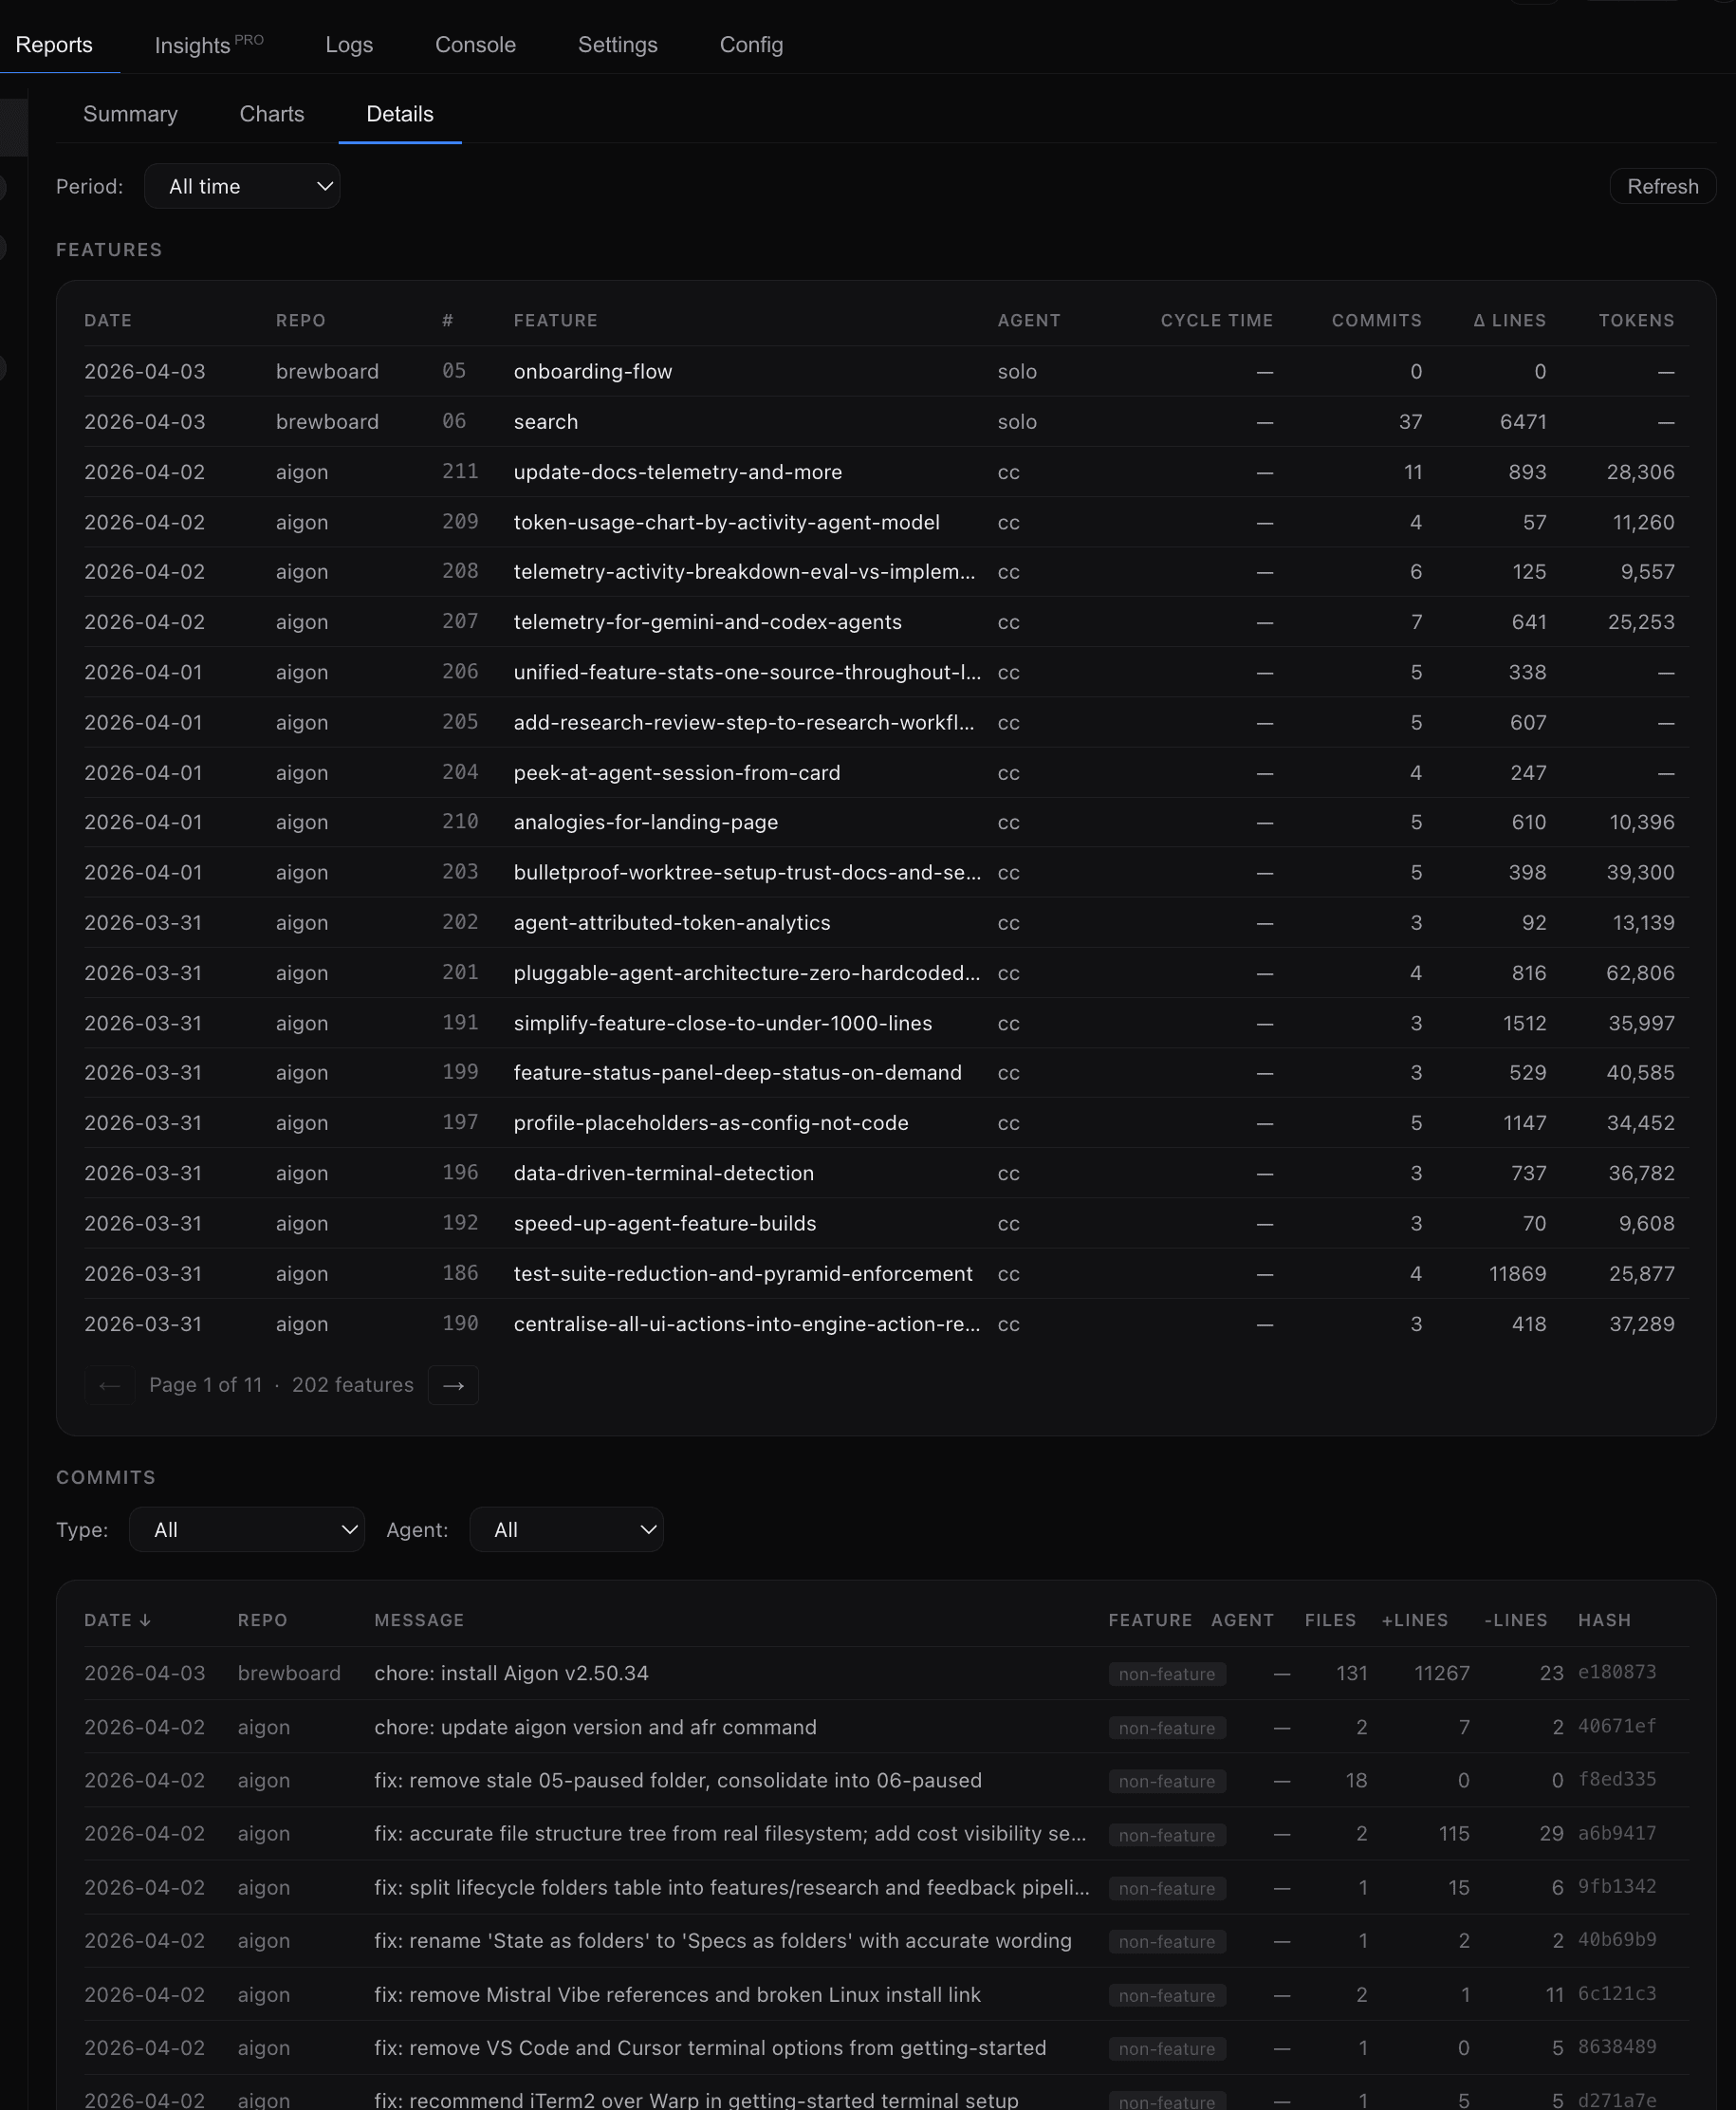
Details
Paginated tables for drilling into individual items:
- Features — paginated, sortable table with date, repo, feature number, name, agent, cycle time, commits, and lines changed
- Commits — sortable table with date, repo, message, feature, agent, files changed, lines added/removed, and commit hash. Non-feature commits show a “non-feature” badge. Filterable by type (All / Feature only / Non-feature only) and agent
Activity breakdown
Each telemetry record includes an activity field — implement, evaluate, or review — so you can see where tokens are being spent. With Pro, the Insights tab’s Token Usage by Activity chart visualizes this breakdown over time.
For details on what is collected, how cost is computed, and how to interpret activity data, see the Telemetry & Analytics guide.
Pro Features
The Reports tab includes additional Pro-gated charts and cards with Aigon Pro:
- Additional charts — Median Cycle Time, Commits per Feature, Rework Ratio, and Tokens Used unlock alongside the free Features Completed and Commits charts
- Additional summary cards — Commits/Feature and Rework Ratio cards in the Summary sub-tab
Pro also adds Settings → Aigon Sync for vault push/pull to a private Git remote, and the Insights tab (labeled with PRO in the nav) with:
- Quality metrics — First-Pass Rate (No Rework), Median Cost/Feature, Median Tokens/Line Changed
- Token analytics — distribution histograms, per-agent breakdowns, activity-level token tracking
- AI coaching — AI-generated observations and actionable recommendations
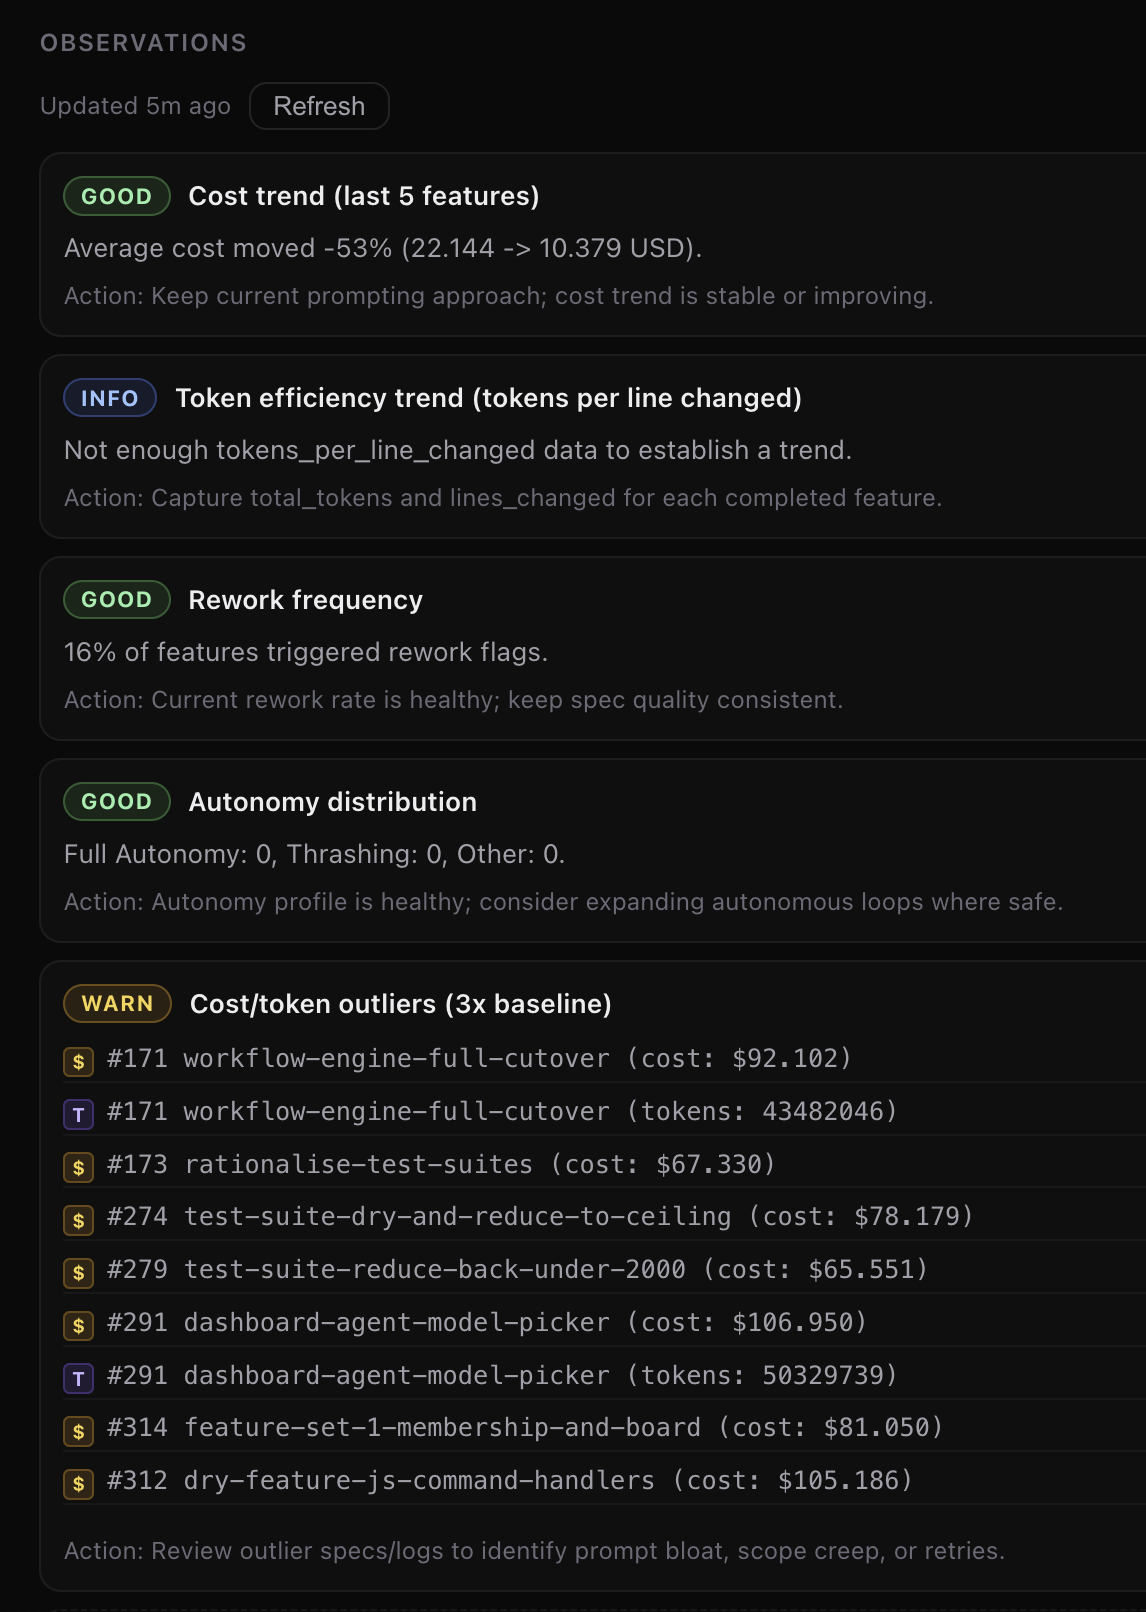
These Pro features build on the same data the free Reports tab already collects — Pro adds deeper analysis and AI-powered interpretation. See the Insights guide for a full walkthrough.
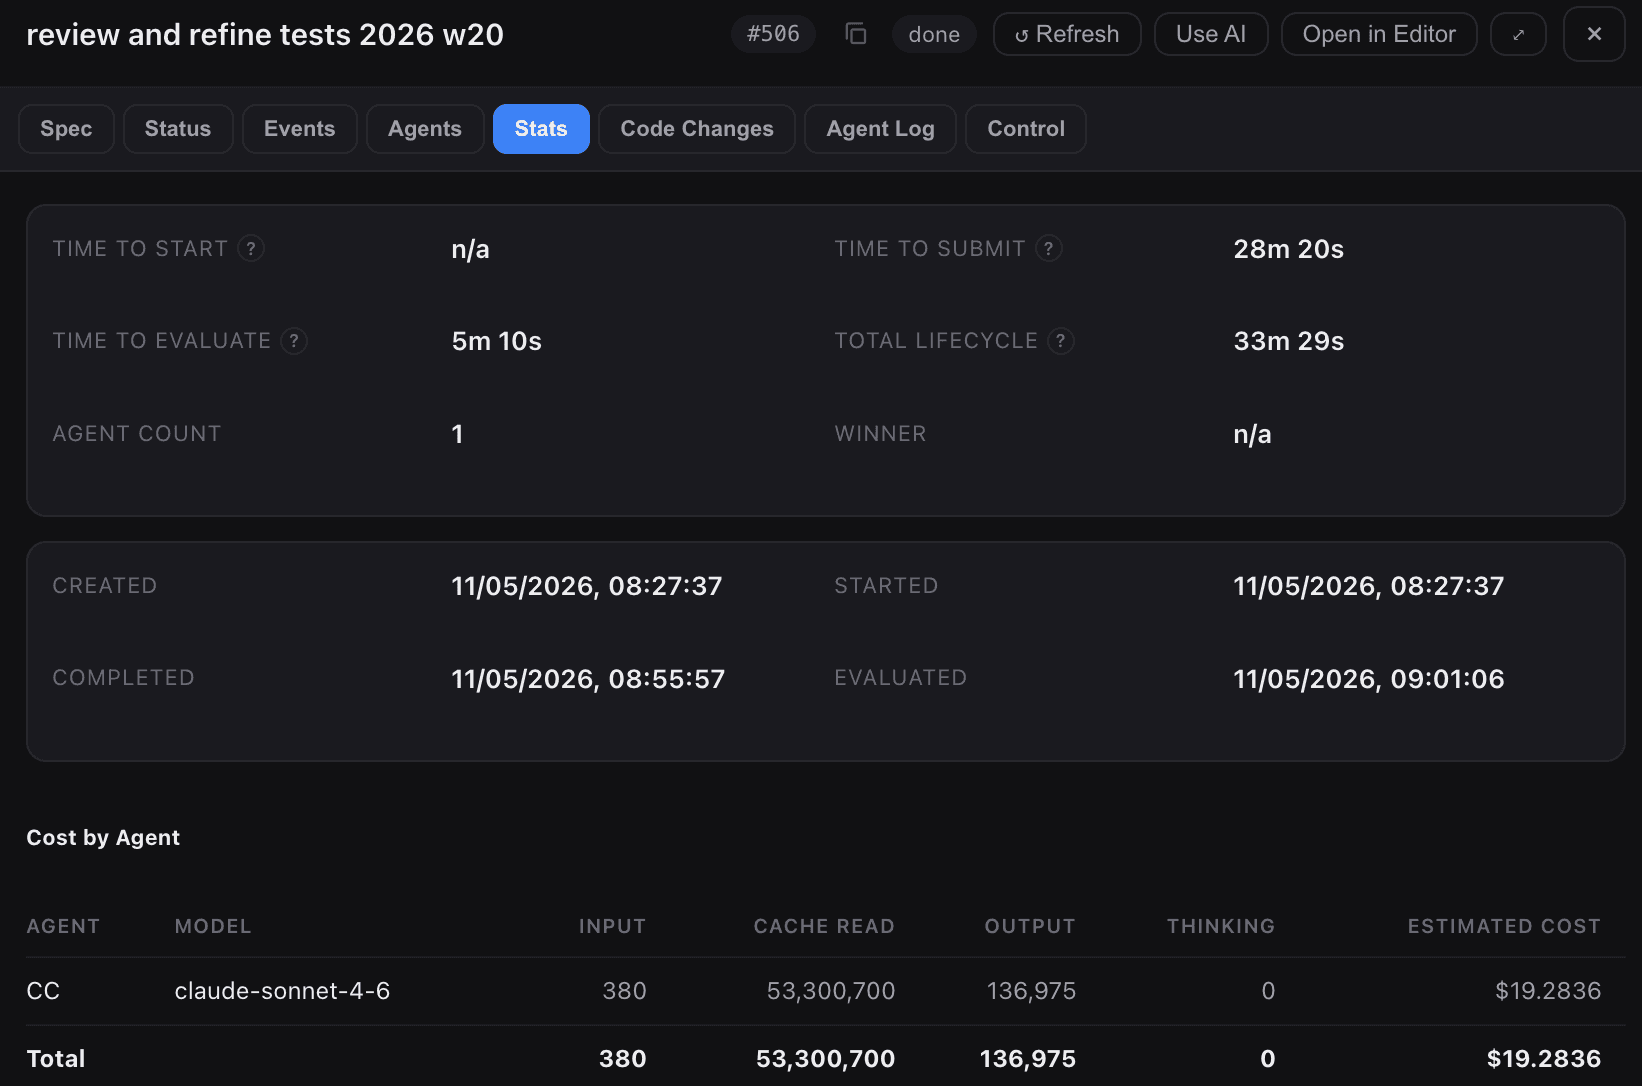
Code Changes tab
Open any feature spec drawer and the Code Changes tab (between Stats and Agent Log) lists the git commits that make up the feature. It works at every lifecycle stage:
- In-progress: reads commits from the live worktree branch (everything ahead of
main). - Done / merged: locates the
Merge feature {id}commit onmainand walks back its constituent commits. - Empty: when no commits exist yet, the tab shows “No commits yet.”
Each row shows the short hash (click to copy), commit message, author, and a relative timestamp. Expand a row to see the file list with +/- line counts. The tab is feature-only — research entities don’t show it.
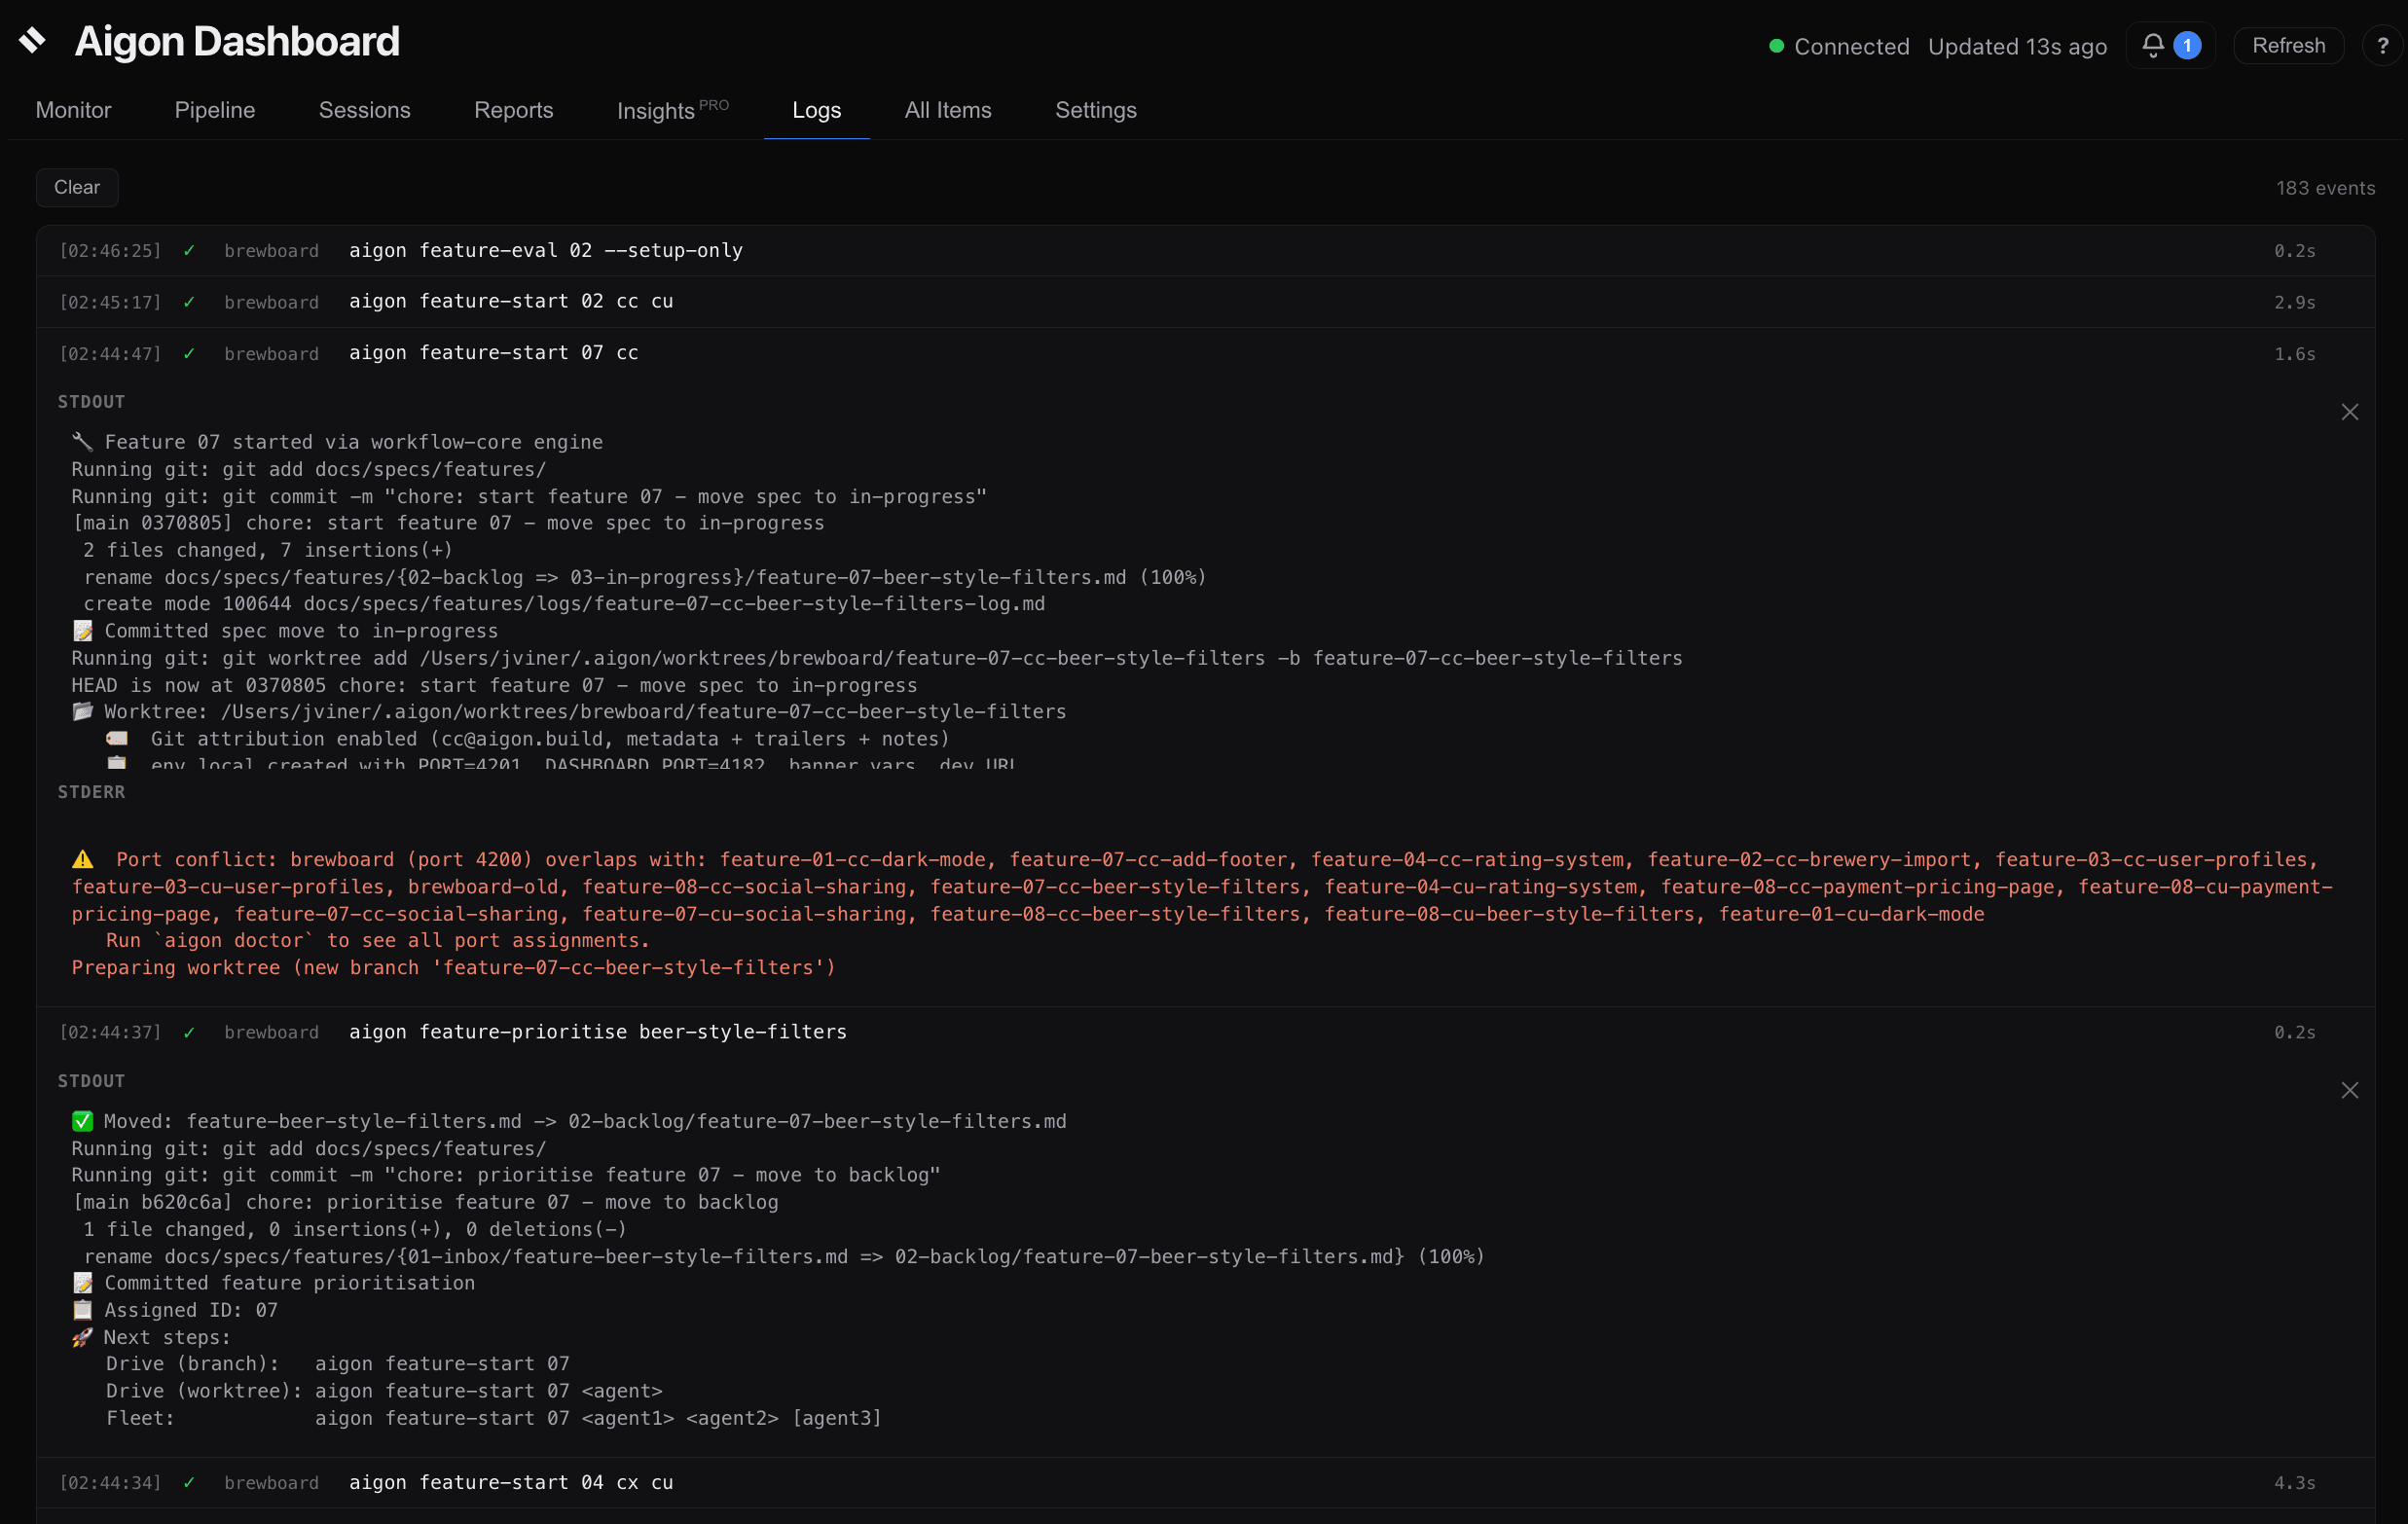
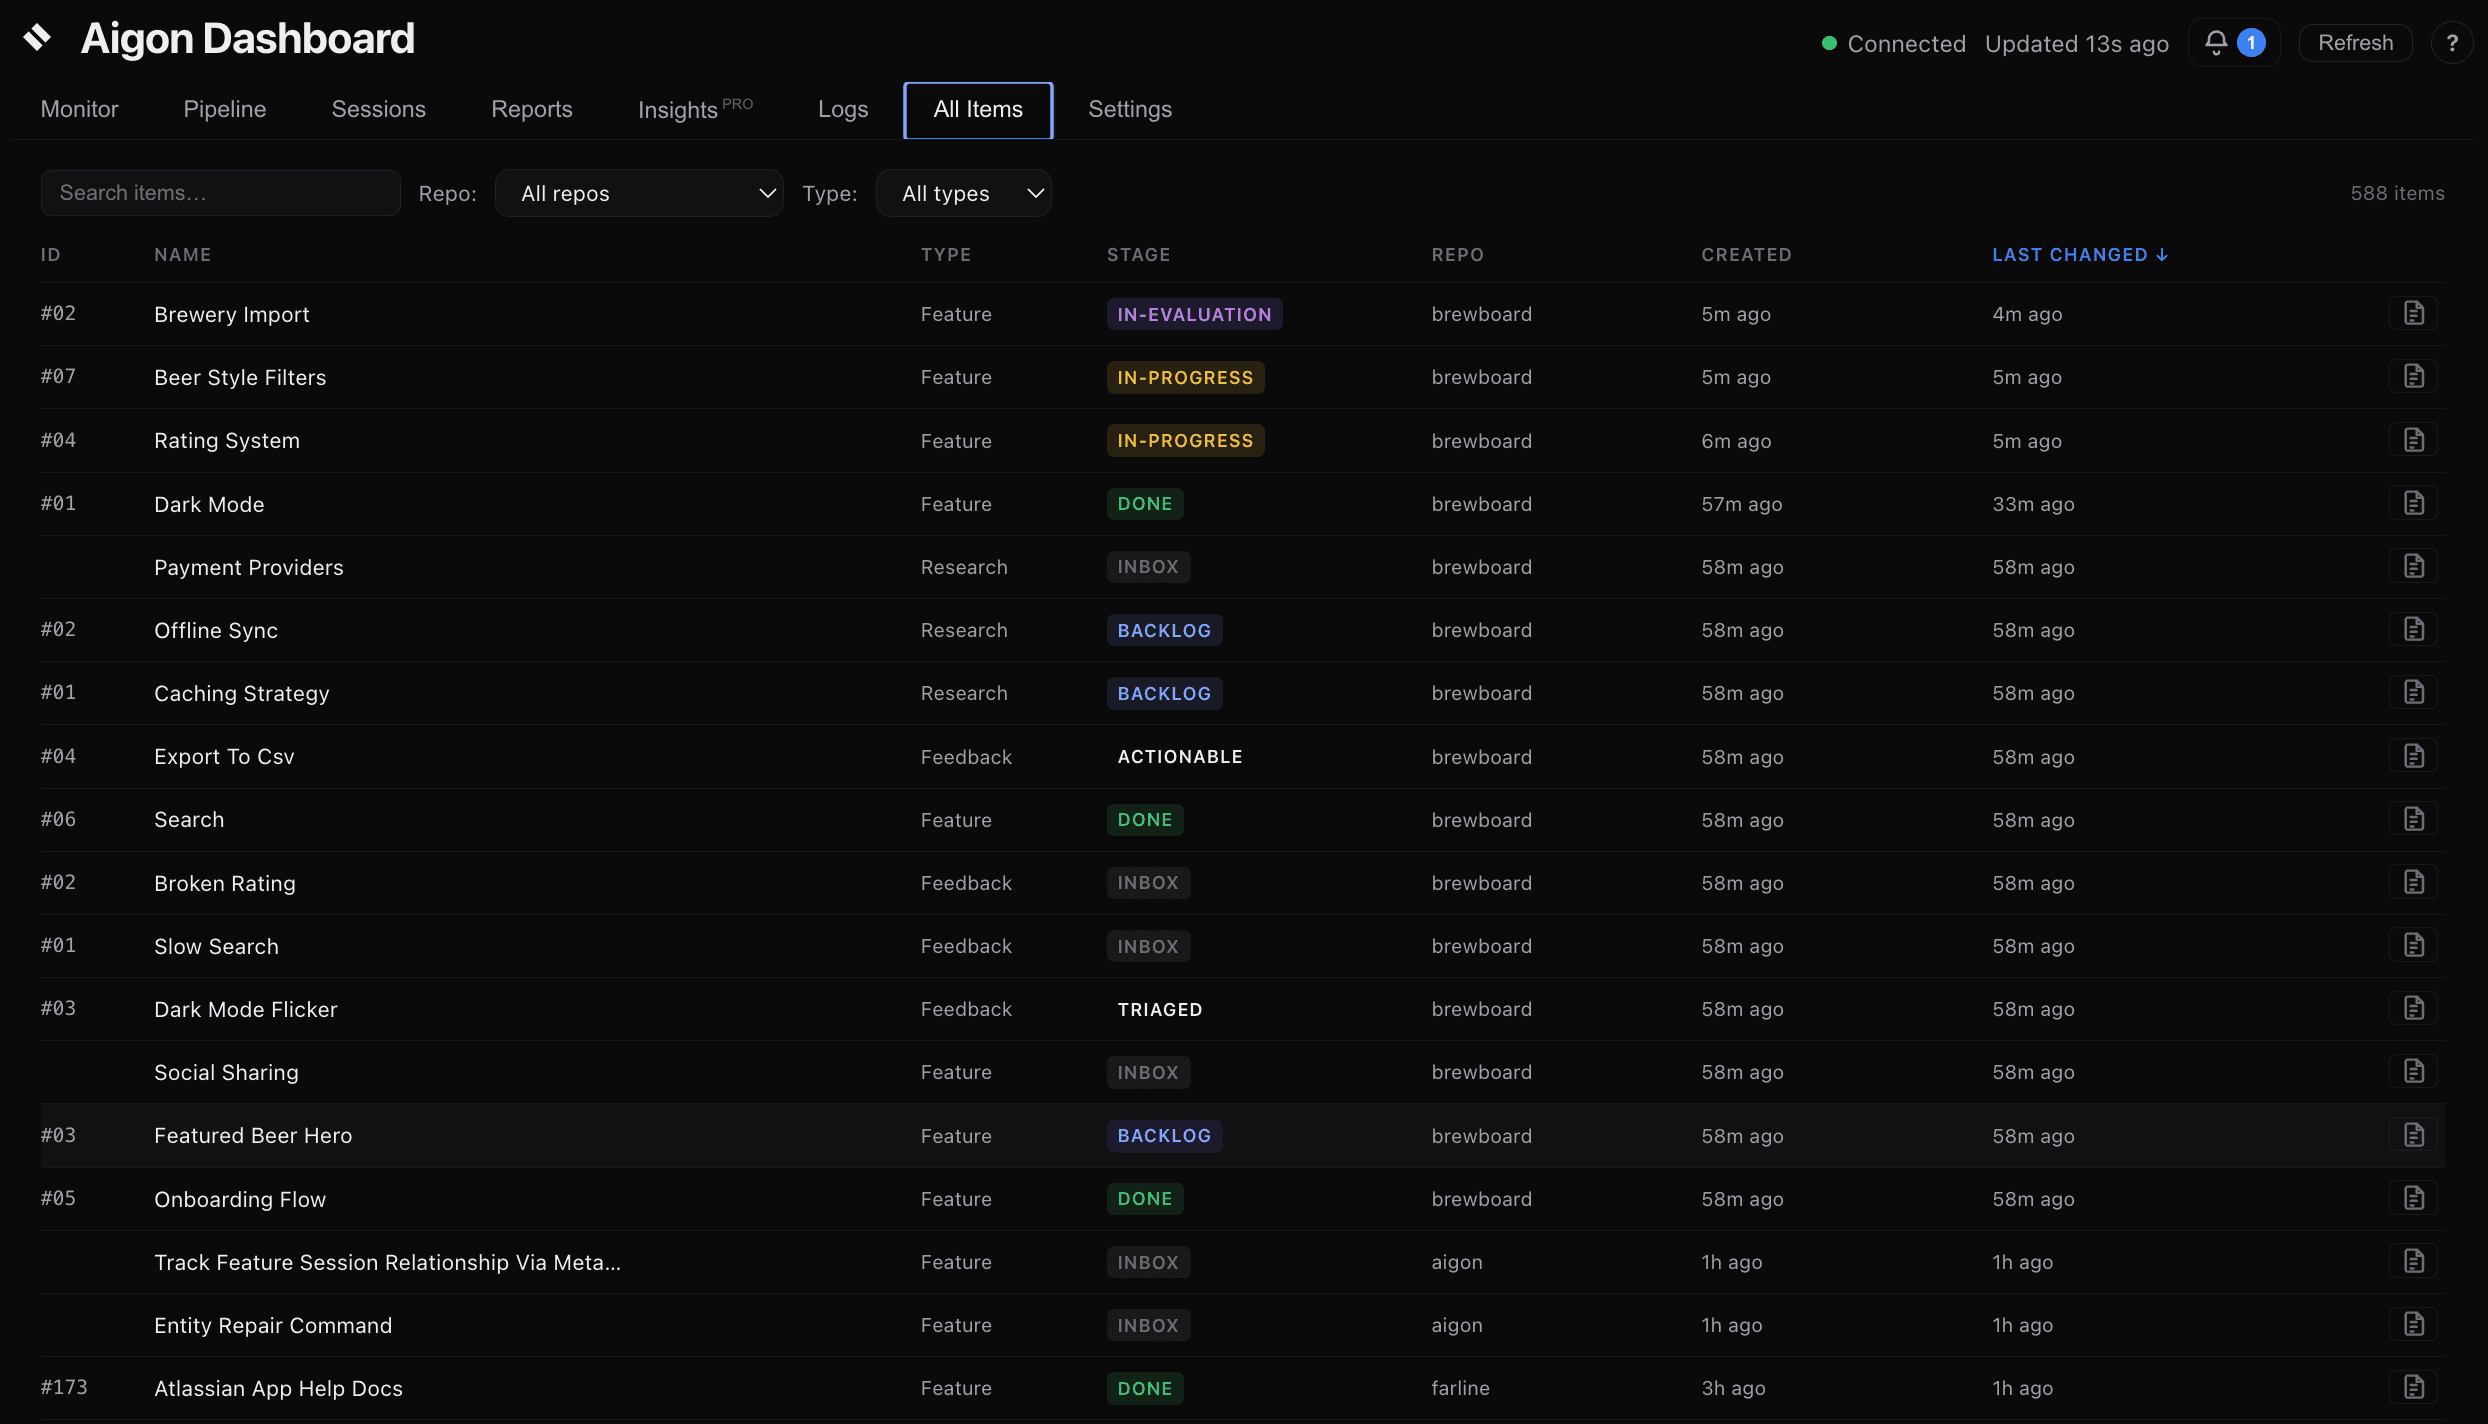
Logs and All Items
View live agent output in Logs and the repo-wide All Items index for features, research, and feedback.
Managing repos
aigon server add ~/src/my-project       # Register a repo
aigon server add ~/src/another-project  # Add more repos
aigon server list                       # See registered repos
aigon server remove ~/src/old-project   # Unregister a repo
Server commands
aigon server start --persistent   # Install as system service (recommended, one-time)
aigon server start                # Start in foreground (alternative)
aigon server restart              # Restart (e.g. after `npm update -g @senlabsai/aigon`)
aigon server status               # Check health, PID, uptime
aigon server stop                 # Stop the server
aigon server open                 # Open in browser
When to restart
The server auto-restarts on crash. You need to restart manually after npm update -g @senlabsai/aigon (so the dashboard process picks up the new code), or if you are developing Aigon itself and editing lib/*.js files. Config changes and new repo registrations are picked up automatically without a restart.
Upgrade pill (chrome)
When a newer Aigon is available on npm, the dashboard’s running code is behind the installed CLI, or one of your registered repos is behind on aigon apply, the dashboard chrome shows a slim pill that walks you through the upgrade arc in three phases:
- Phase 1 — npm has newer:
↑ aigon vX.Y available [ Show ]. Expand for thenpm updatecommand to copy. - Phase 2 — restart the dashboard:
✓ aigon vX.Y installed. Restart the dashboard to use it. [ Restart now ]. The button callsPOST /api/server/restart; the page reconnects when the WebSocket comes back up. - Phase 3 — re-apply to your repos:
↻ Re-apply aigon vX.Y to your repos. [ Show repos ▾ ]. Expand to see every registered repo with per-row[ Preview ]and[ Re-apply ], plus an aggregate[ Re-apply all N stale repos ](runsaigon apply --all).
No phase auto-advances — every transition requires an explicit click. The pill is absent from the DOM when everything is current. See Applying Aigon updates to your repos for the full flow.
Settings → Version
Settings → Version mirrors the data the upgrade pill uses, plus Pro state:
| Row | What it shows |
|---|---|
| Installed | Aigon CLI version currently on disk |
| Latest stable / Latest next | Latest registry versions from the cached npm check |
| Status | up to date / update available / prerelease available / unavailable |
| Upgrade command | The npm update -g @senlabsai/aigon line to copy |
| Pro package | Whether @senlabsai/aigon-pro is installed (and the resolved version) |
| Pro key | Whether proKey is present in ~/.aigon/config.json |
| Pro status | active, installed (not activated), or not installed |
| Registry error | Last npm registry error, if any |
Remote access
The dashboard binds to 0.0.0.0 by default, making it accessible from any device on the local network.
- Same WiFi: Open
http://<mac-ip>:4100in a browser - Outside LAN: Install Tailscale on both devices, then use
http://<tailscale-ip>:4100
Terminal board view
For a quick text-based overview without opening a browser:
aigon board                    # Kanban view
aigon board --list             # List view
aigon board --features         # Features only
aigon board --research         # Research only