Aigon collects telemetry from every agent session — Claude Code, Gemini CLI, and Codex CLI — and normalizes it into a unified format. This gives you a single view of token usage, cost, and activity across your entire multi-agent workflow.
What is collected
After each feature session, Aigon parses agent-specific transcript files to extract:
| Field | Description |
|---|---|
| Token usage | Input tokens, output tokens, cache read/write tokens per conversation turn |
| Model | Which model was used (e.g. claude-sonnet-4-6, gemini-2.5-flash, gpt-5) |
| Cost | Computed from token counts and a built-in pricing table |
| Activity type | Whether the session was an implement, evaluate, or review activity |
| Duration | Session wall-clock time from first to last message |
| Agent | Which agent CLI produced the session (cc, gg, cx) |
Telemetry is stored locally in .aigon/telemetry/ — nothing is sent to external services.
Agent parsers
Each agent CLI writes transcripts in a different format. Aigon includes a parser for each:
| Agent | Transcript location | Format |
|---|---|---|
| Claude Code (cc) | .claude/projects/*/transcripts/*.jsonl | JSONL with usage blocks per assistant turn |
| Gemini CLI (gg) | ~/.gemini/tmp/ session JSON | JSON with token counts in response metadata |
| Codex CLI (cx) | ~/.codex/sessions/ | JSONL matched by working directory |
| Cursor (cu) | — | No telemetry — Cursor does not expose session data |
Parsers run automatically during feature-close and submission signaling — no manual step is needed.
Activity breakdown
Every telemetry record includes an activity field that classifies the session:
| Activity | When it applies |
|---|---|
implement | Agent is writing code for a feature (the default) |
evaluate | Agent is running feature-eval to compare Fleet implementations |
review | Agent is running feature-code-review for cross-agent code review |
This distinction lets you answer questions like:
- How much of my token spend goes to implementation vs. evaluation?
- Which activity type is most expensive per feature?
- Are review sessions getting shorter over time?
Cost attribution
Aigon maintains a pricing table covering Claude, Gemini, and GPT-5 model families. Costs are computed per-turn using actual token counts:
cost = (input_tokens × input_rate)
     + (output_tokens × output_rate)
     + (cache_read_tokens × input_rate × 0.10)
     + (cache_write_tokens × input_rate × 1.25)
Cache-aware pricing means you see the real cost, not a worst-case estimate. If a model ID isn’t in the pricing table, Aigon falls back to Sonnet-tier rates as a conservative default.
Reading the Reports tab
The Dashboard Reports tab visualizes telemetry data across all your repos. Here’s how to find the telemetry-specific views:
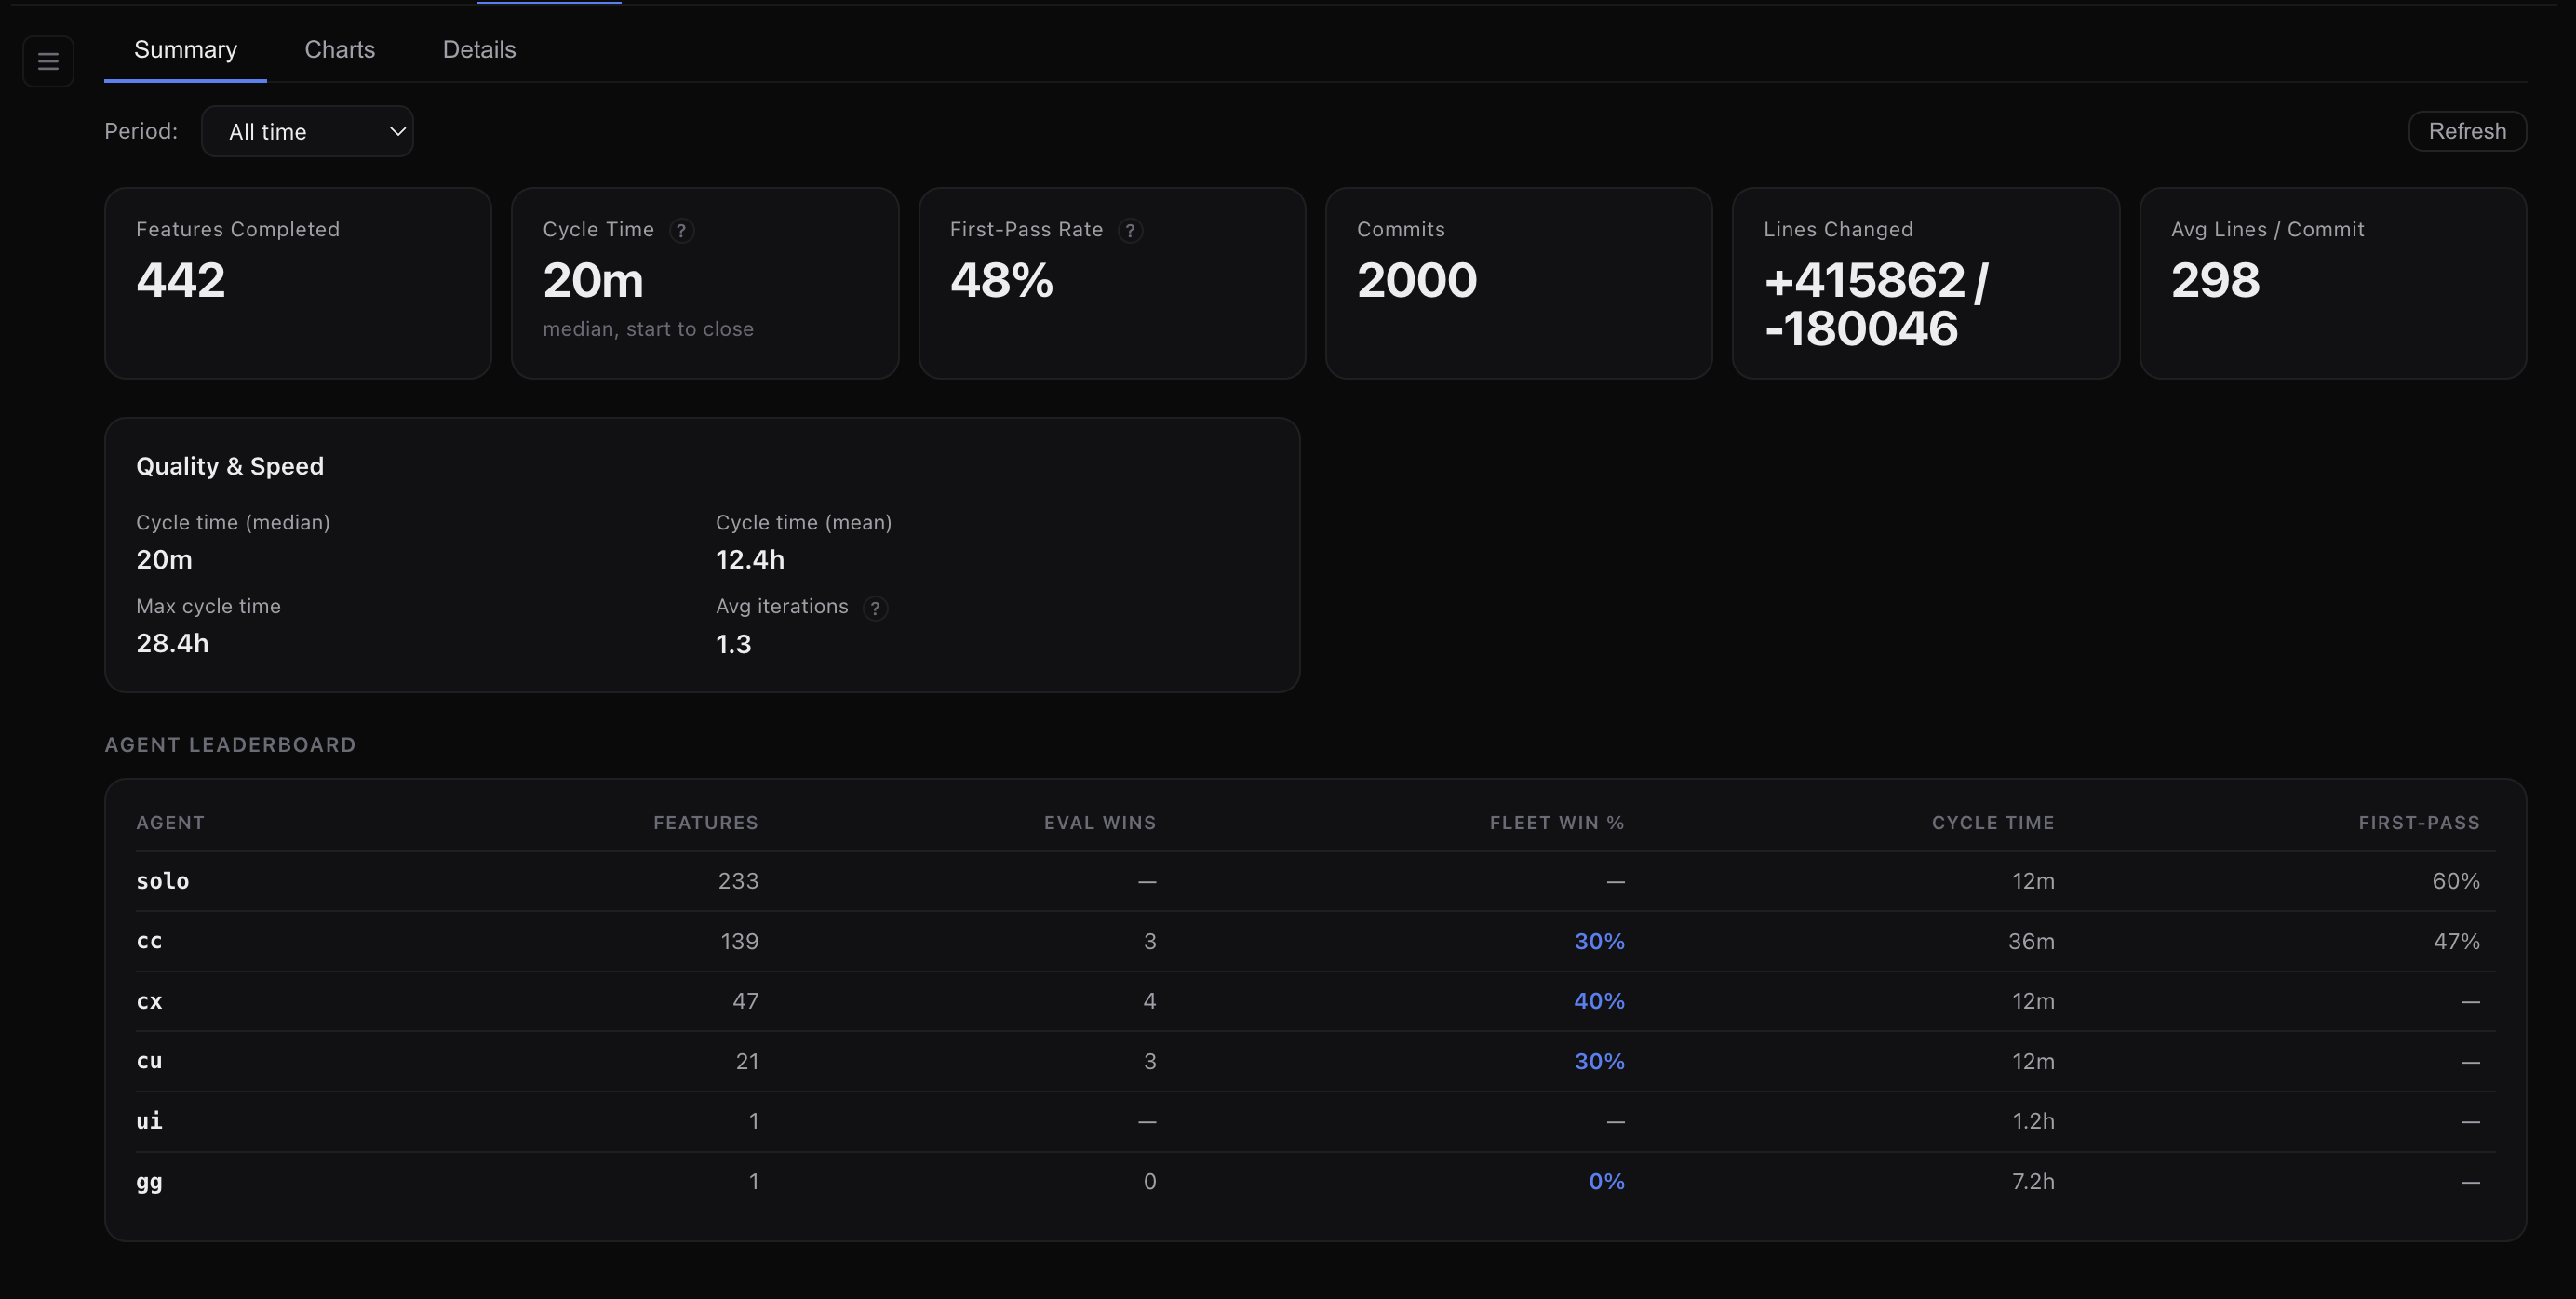
Summary cards
The Summary sub-tab shows aggregate metrics. Look for:
- Features Completed with cost attribution per agent
- Agent Leaderboard showing per-agent token spend alongside performance metrics
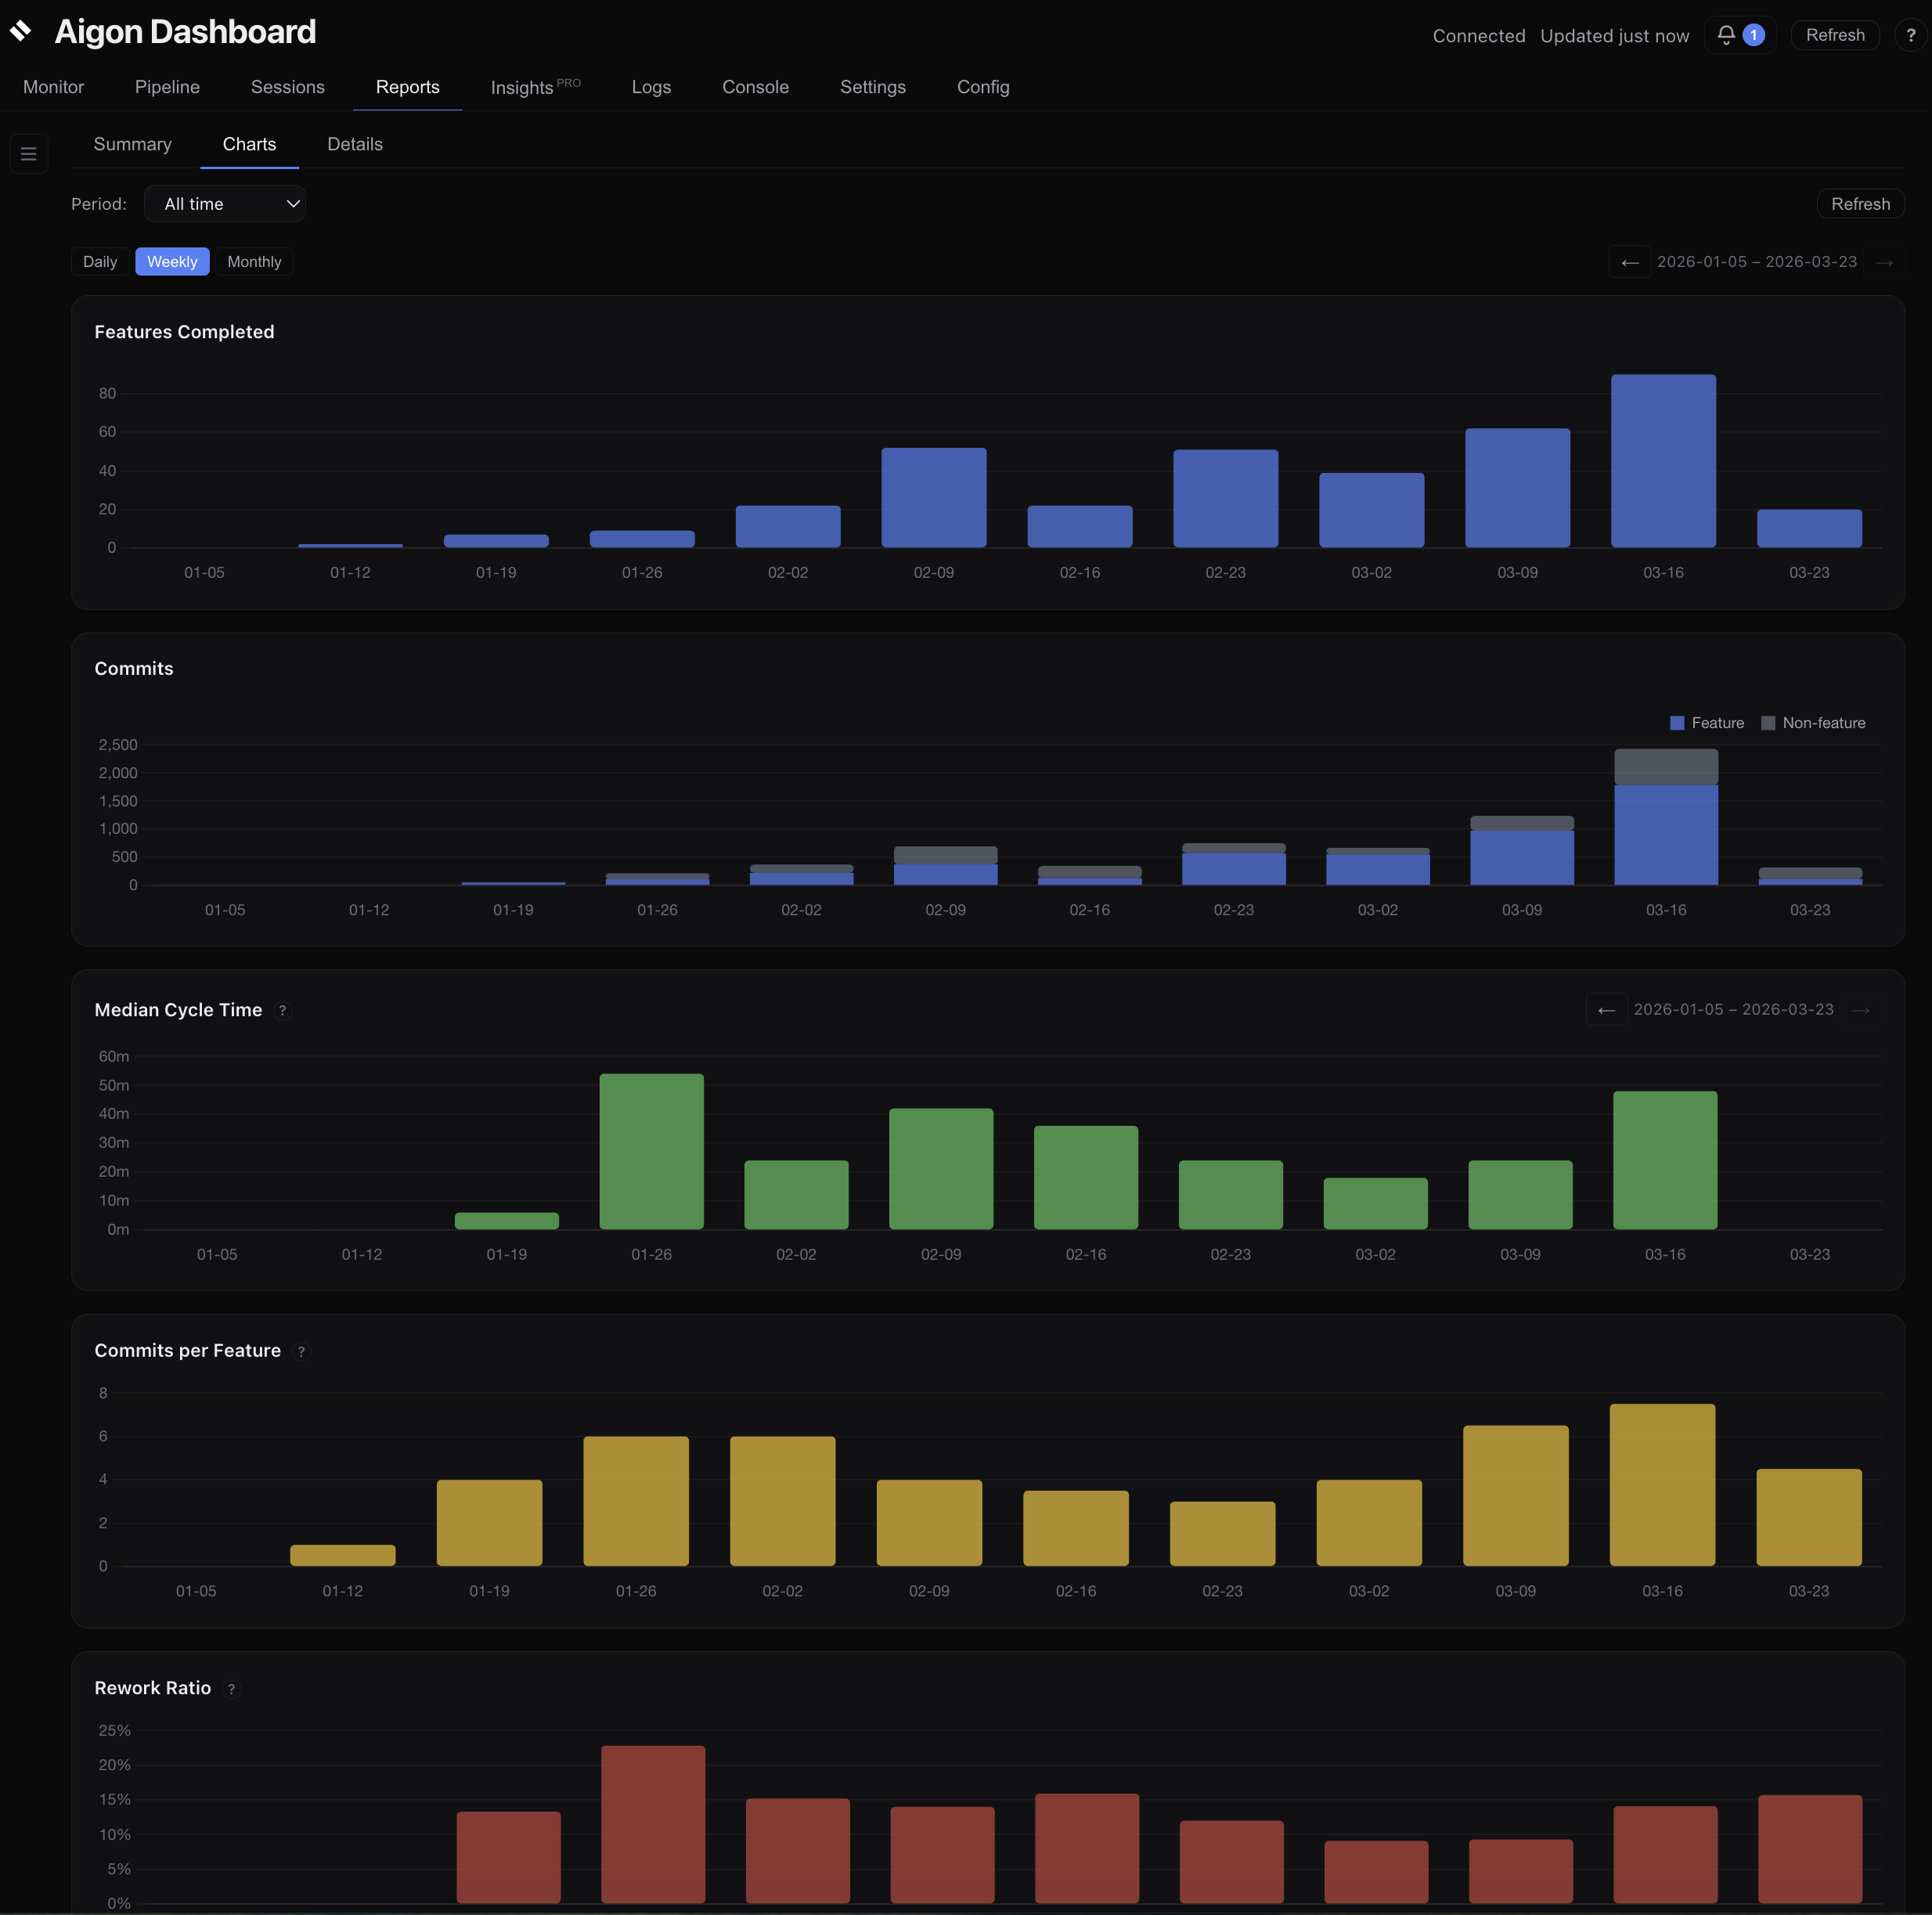
Charts
The Charts sub-tab includes time-series charts with a daily/weekly/monthly granularity toggle and synchronized panning. Two charts are available on the free tier:
- Features Completed — bar chart of features closed per period
- Commits — stacked bar chart (feature vs. non-feature commits)
With Aigon Pro, four additional charts unlock:
- Median Cycle Time — bar chart of median cycle time per period
- Commits per Feature — median commits per feature completed
- Rework Ratio — percentage of fix commits per period
- Tokens Used — total billable tokens consumed per period
The Pro Insights tab adds even deeper token analytics — per-agent cost breakdowns, token efficiency trends, and token usage by activity type. See the Insights guide for details.
Free tier vs. Pro
The free Reports tab gives you:
- Two charts (Features Completed, Commits)
- Summary metric cards (features completed, commits, lines changed)
- Detail tables (features and commits)
Aigon Pro adds to the Reports tab:
- Four additional charts (Cycle Time, CPF, Rework Ratio, Tokens Used)
- Additional summary cards (Commits/Feature, Rework Ratio)
- Agent leaderboard
Pro also adds the Insights tab with deeper token and quality analytics:
- First-pass rate, median cost/feature, token efficiency metrics
- Cost and token-efficiency sparkline trends
- Token analytics (distribution, per-agent breakdown, activity breakdown)
- AI-generated insights and coaching recommendations
See the Insights guide for details.
Troubleshooting
No telemetry data showing up?
- Make sure you’ve closed at least one feature — telemetry is collected during
feature-close - Check that transcript files exist for your agent (see the parser table above)
- Verify the agent session ran long enough to generate transcript data
Cost showing as $0?
The model ID in the transcript may not match the pricing table. Aigon falls back to Sonnet pricing, but if the transcript has no usage blocks at all, costs will be zero. This typically means the agent session was too short to generate meaningful output.
Next steps
- Dashboard guide — full walkthrough of all dashboard tabs
- Insights — Pro-tier quality and token analytics
- Fleet Mode — multi-agent workflows that generate the most telemetry data